 14
14peptides
spectra
0.000 | 0.000
0.597 | 0.629
0.000 | 0.000
0.000 | 0.000
0.145 | 0.194
0.091 | 0.162
0.074 | 0.088
0.000 | 0.000
| Plot | Mito | Lyso | Perox | ER | Golgi | PM | Cytosol | Nucleus | |||||
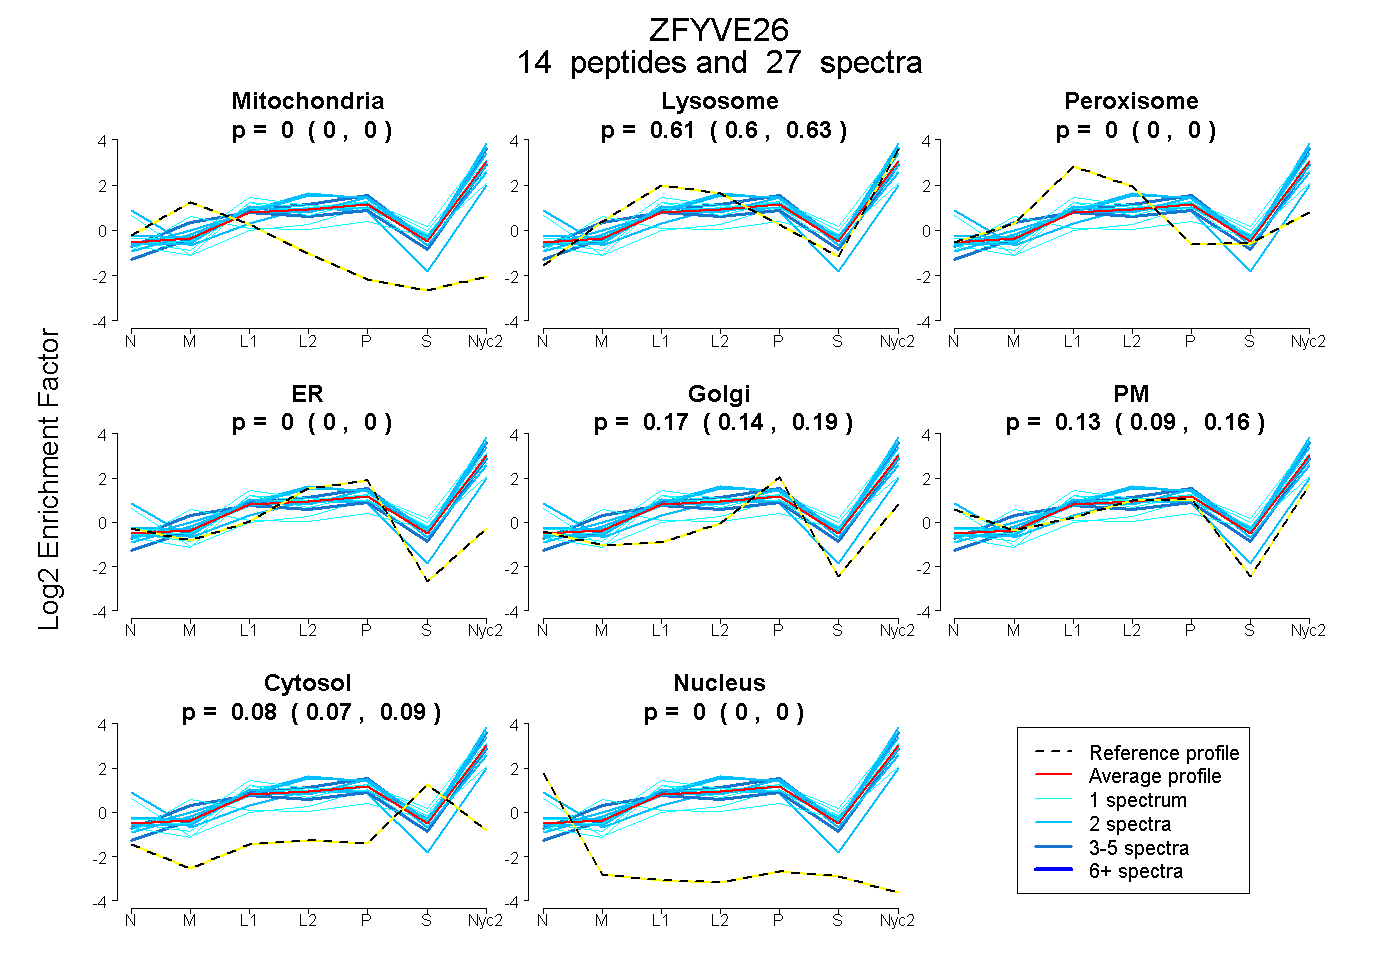
| Expt A |
14 peptides |
27 spectra |
|
0.000 0.000 | 0.000 |
0.615 0.597 | 0.629 |
0.000 0.000 | 0.000 |
0.000 0.000 | 0.000 |
0.172 0.145 | 0.194 |
0.131 0.091 | 0.162 |
0.082 0.074 | 0.088 |
0.000 0.000 | 0.000 |
| 1 spectrum, VLLTLPEQHR | 0.064 | 0.540 | 0.000 | 0.000 | 0.188 | 0.000 | 0.208 | 0.000 | ||
| 1 spectrum, LLGCLLHK | 0.000 | 0.613 | 0.000 | 0.000 | 0.163 | 0.096 | 0.128 | 0.000 | ||
| 2 spectra, DHPDPER | 0.000 | 0.772 | 0.000 | 0.000 | 0.180 | 0.048 | 0.000 | 0.000 | ||
| 1 spectrum, QTLAGPR | 0.000 | 0.668 | 0.000 | 0.000 | 0.164 | 0.032 | 0.136 | 0.000 | ||
| 2 spectra, NQDQGHDELLR | 0.000 | 0.545 | 0.000 | 0.000 | 0.000 | 0.320 | 0.135 | 0.000 | ||
| 5 spectra, HLLYLLER | 0.000 | 0.635 | 0.000 | 0.000 | 0.199 | 0.105 | 0.061 | 0.000 | ||
| 4 spectra, EALLHLLNK | 0.000 | 0.754 | 0.000 | 0.000 | 0.225 | 0.000 | 0.021 | 0.000 | ||
| 1 spectrum, ALQLLQR | 0.000 | 0.216 | 0.000 | 0.000 | 0.000 | 0.645 | 0.139 | 0.000 | ||
| 2 spectra, SETLEER | 0.000 | 0.752 | 0.000 | 0.000 | 0.210 | 0.000 | 0.038 | 0.000 | ||
| 1 spectrum, QLLFSAK | 0.000 | 0.756 | 0.000 | 0.000 | 0.111 | 0.000 | 0.132 | 0.000 | ||
| 2 spectra, ALQTLR | 0.000 | 0.052 | 0.006 | 0.000 | 0.000 | 0.898 | 0.044 | 0.000 | ||
| 2 spectra, SLLDLIR | 0.000 | 0.693 | 0.000 | 0.000 | 0.260 | 0.000 | 0.047 | 0.000 | ||
| 2 spectra, TQSLFLEAIPDGK | 0.000 | 0.643 | 0.000 | 0.094 | 0.229 | 0.000 | 0.033 | 0.000 | ||
| 1 spectrum, QLLETAER | 0.000 | 0.665 | 0.000 | 0.000 | 0.000 | 0.221 | 0.115 | 0.000 |
| Plot | Mito | Lyso or Perox | ER | Golgi | PM | Cytosol | Nucleus | ||||||
| Expt B |
6 peptides |
9 spectra |
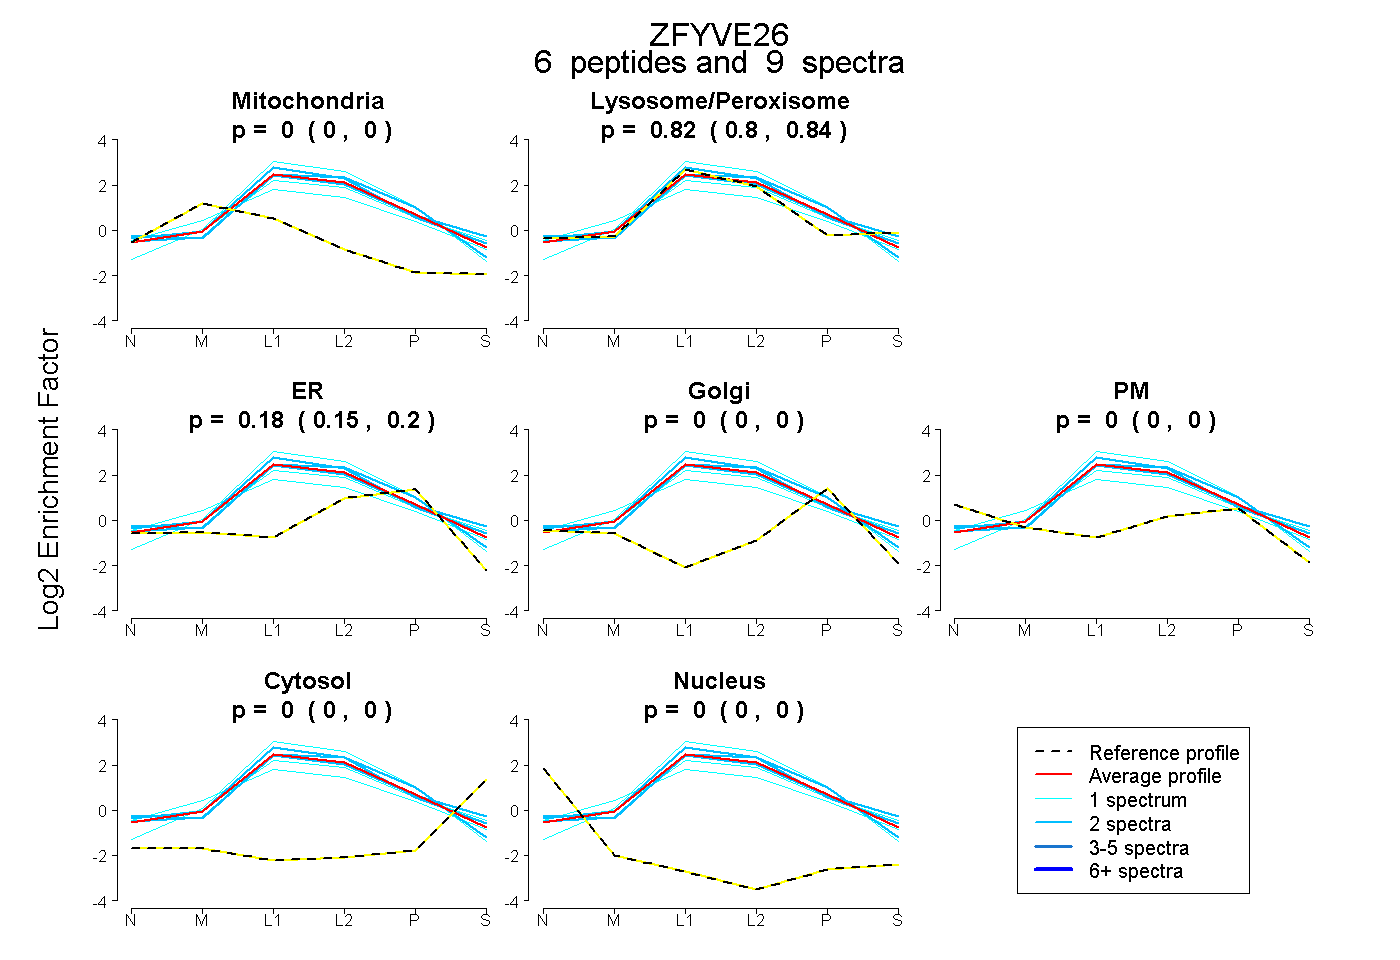 |
0.000 0.000 | 0.000 |
0.821 0.800 | 0.843 |
0.179 0.152 | 0.197 |
0.000 0.000 | 0.000 |
0.000 0.000 | 0.000 |
0.000 0.000 | 0.000 |
0.000 0.000 | 0.000 |
|||
| Plot | Lyso | Other | |||||||||||
| Expt C |
24 peptides |
57 spectra |
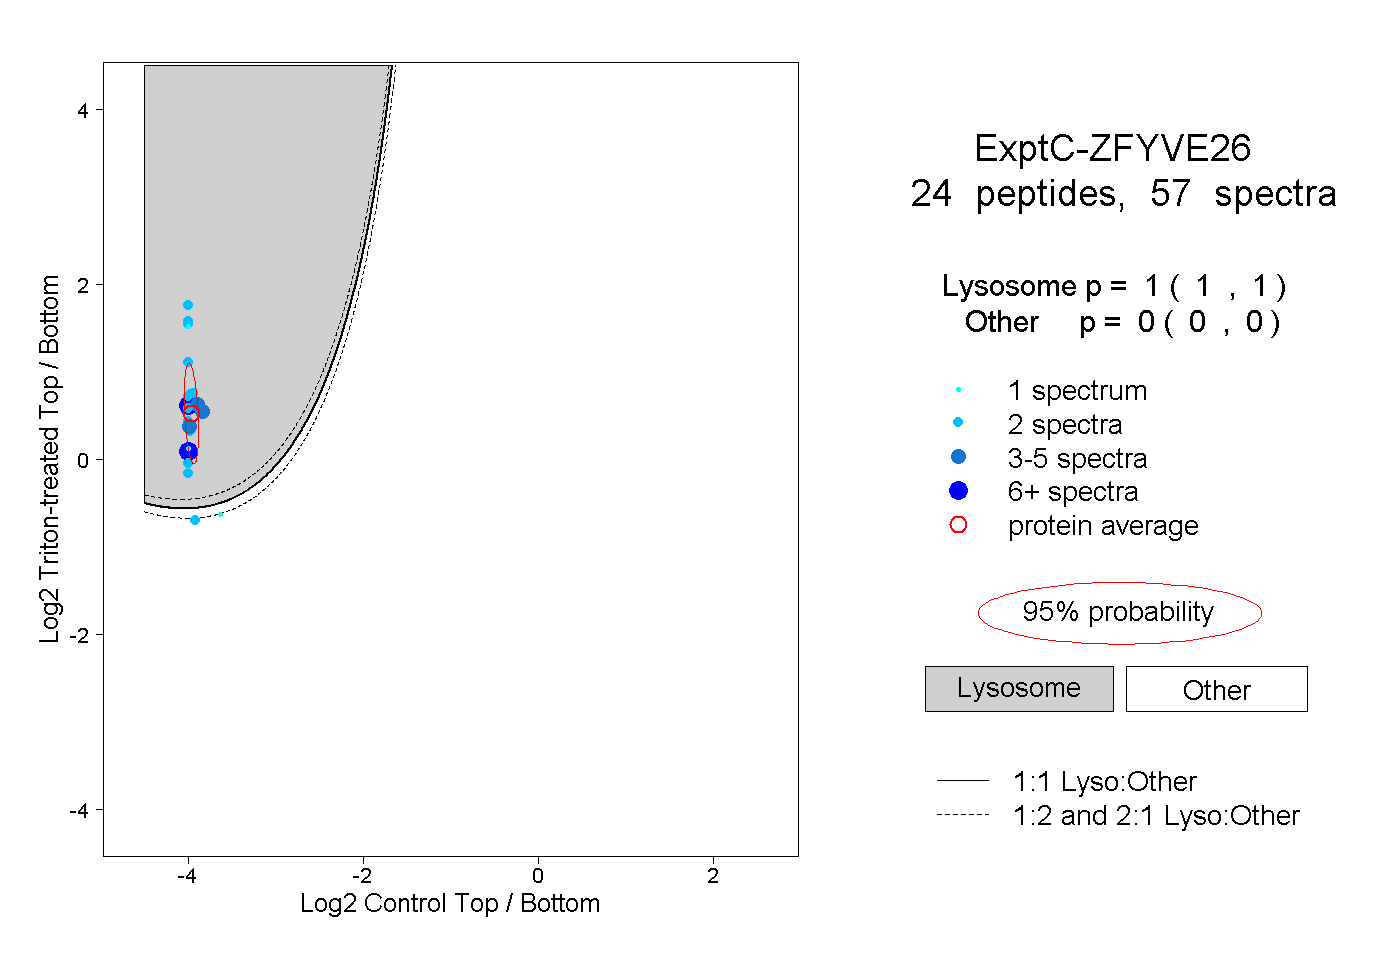 |
1.000 1.000 | 1.000 |
0.000 0.000 | 0.000 |
||||||||
| Plot | Lyso | Other | |||||||||||
| Expt D |
2 peptides |
2 spectra |
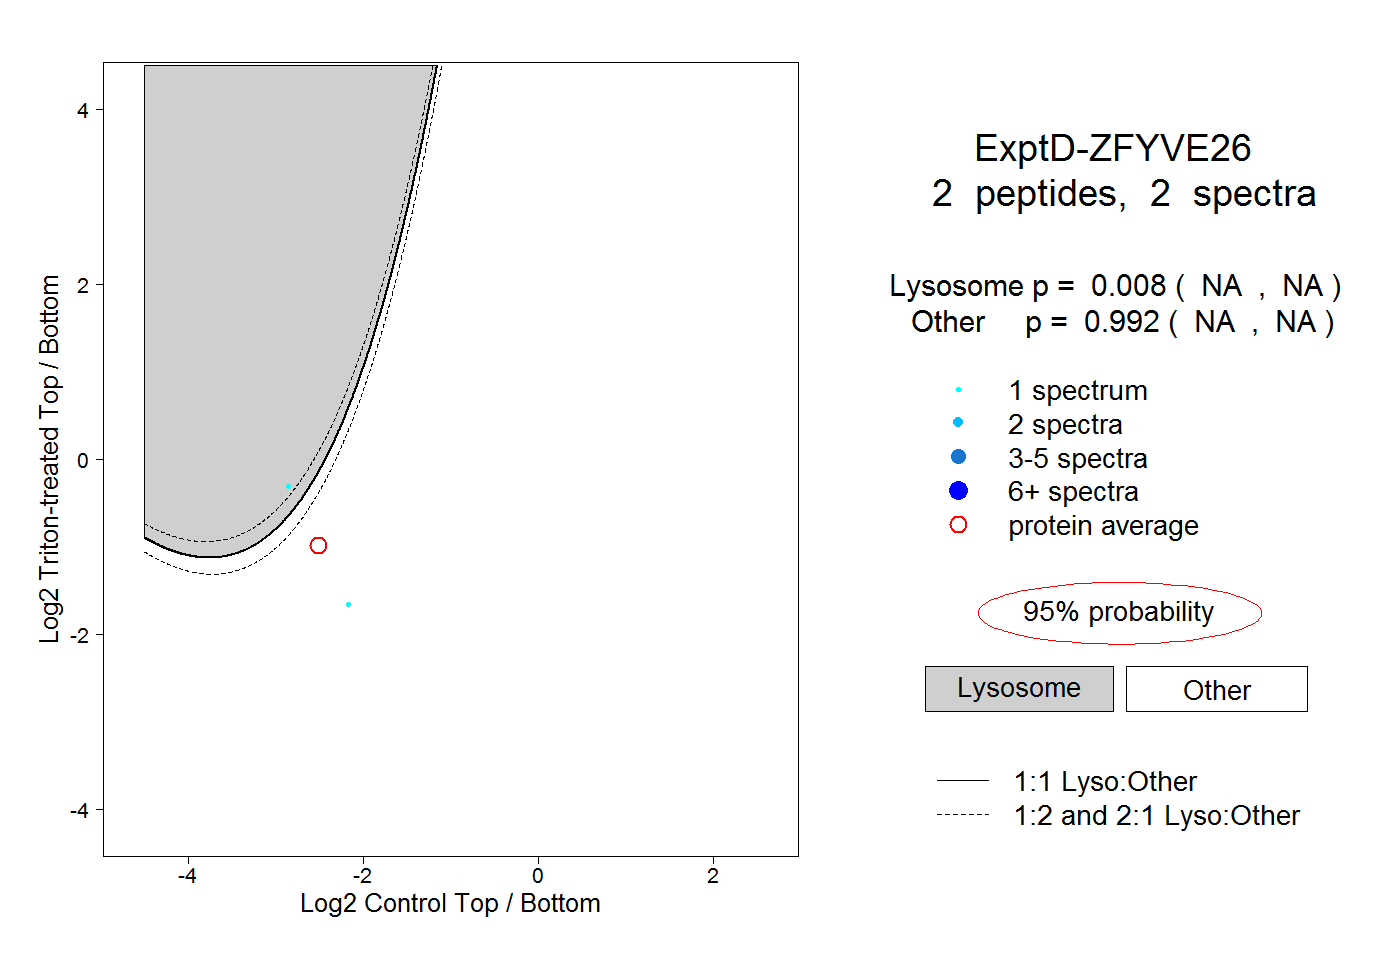 |
0.008 NA | NA |
0.992 NA | NA |