 14
14peptides
spectra
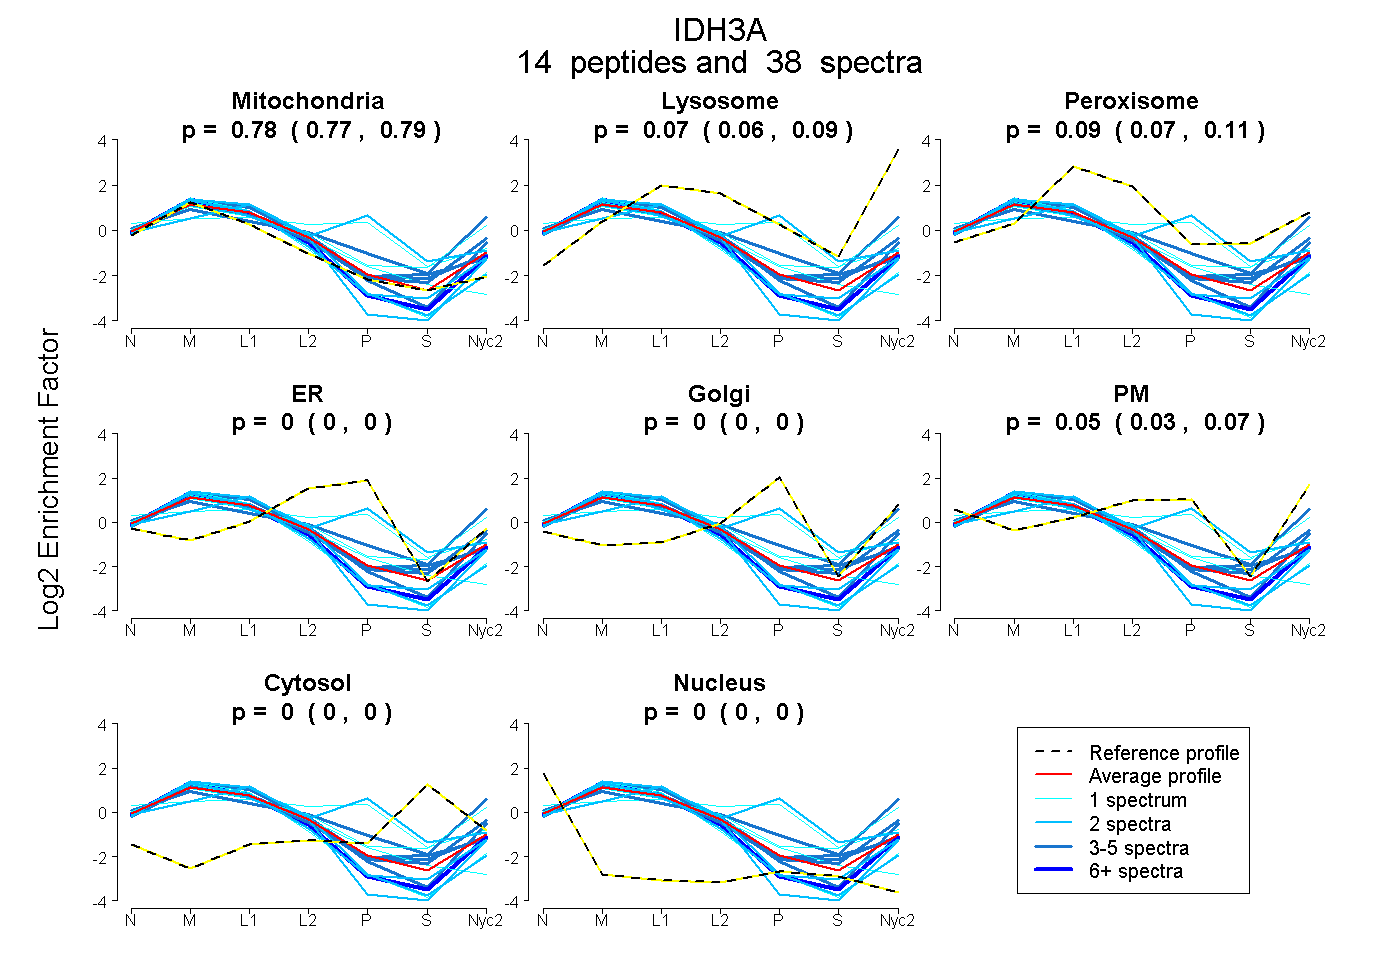
0.768 | 0.791
0.055 | 0.093
0.070 | 0.107
0.000 | 0.000
0.000 | 0.000
0.034 | 0.069
0.000 | 0.000
0.000 | 0.000
9peptides
spectra
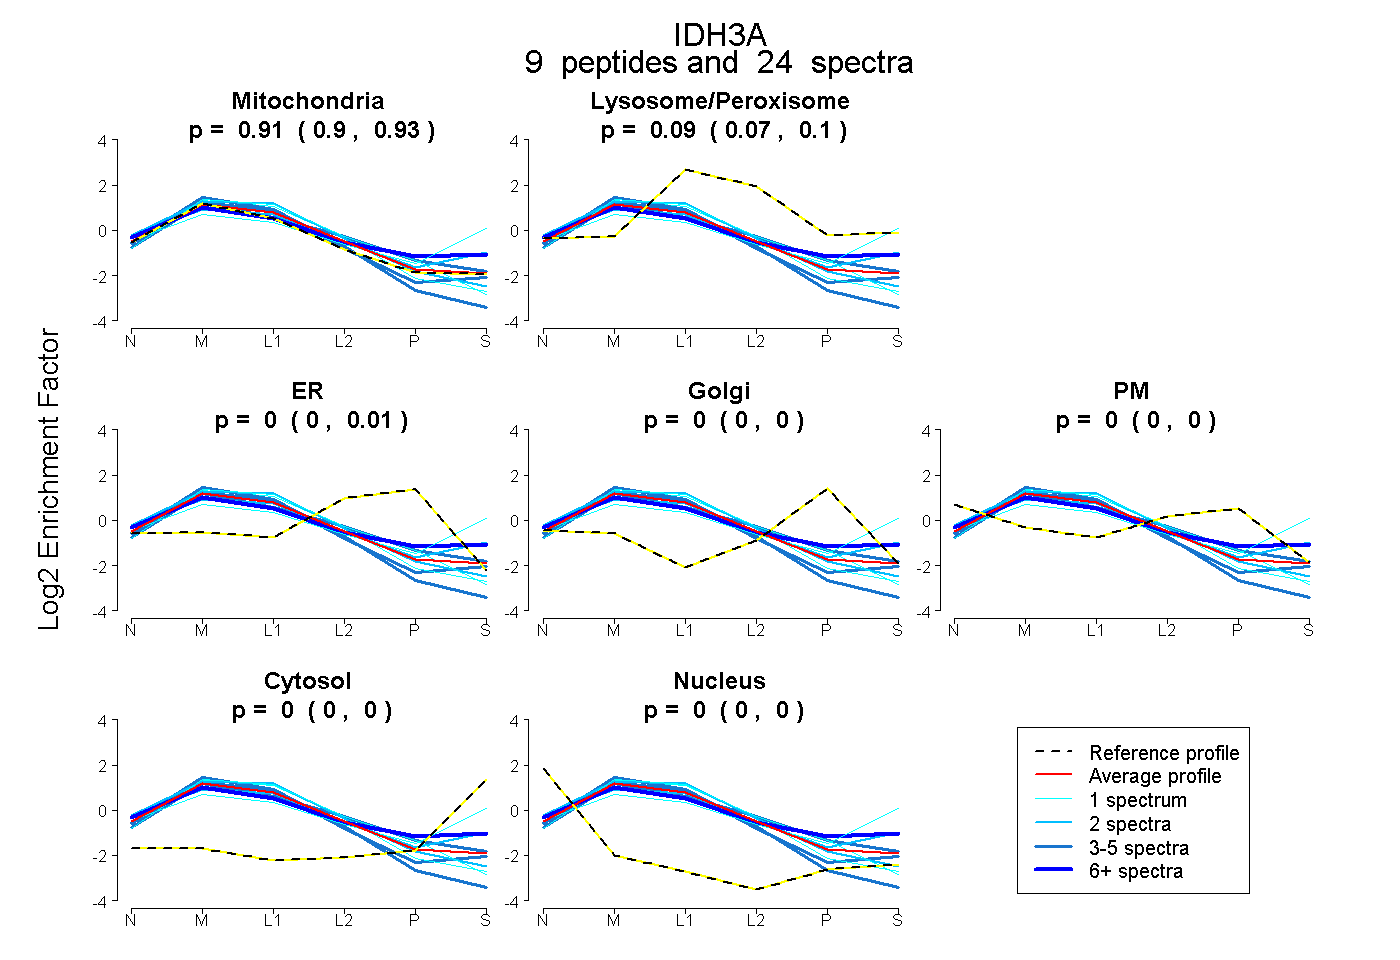
0.898 | 0.926
0.071 | 0.098
0.000 | 0.008
0.000 | 0.000
0.000 | 0.000
0.000 | 0.000
0.000 | 0.000
18peptides
spectra

0.000 | 0.000
1.000 | 1.000
10peptides
spectra
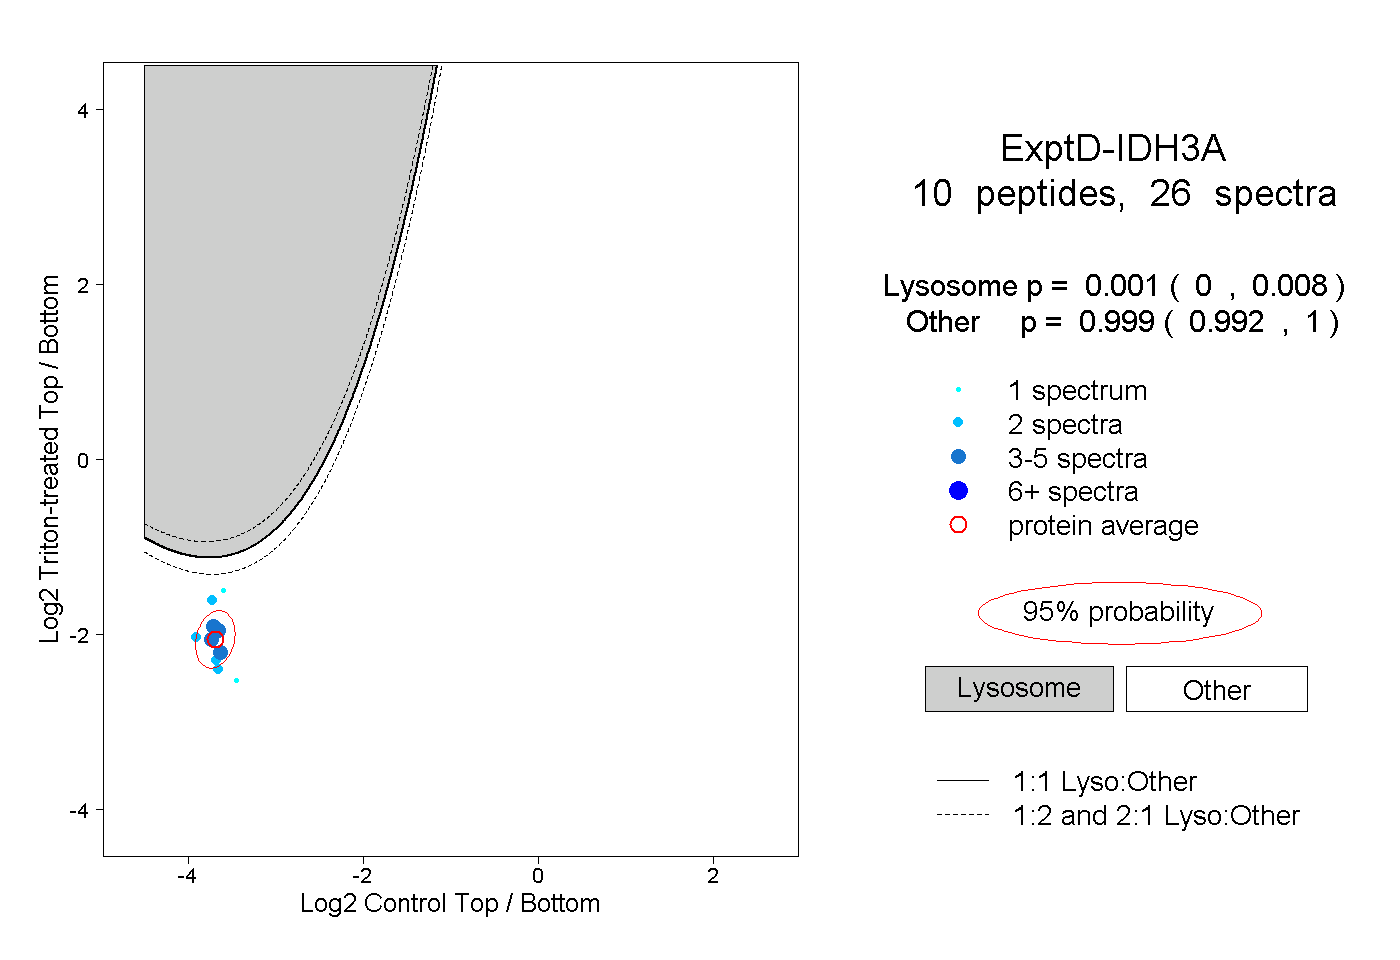
0.000 | 0.008
0.992 | 1.000