IDH3A
[ENSRNOP00000015102]
Main page
| | | Plot |
Mito |
Lyso |
|
Perox |
ER |
Golgi |
PM |
Cytosol |
Nucleus |
|
| Expt A |
 14
14
peptides |
38
spectra |
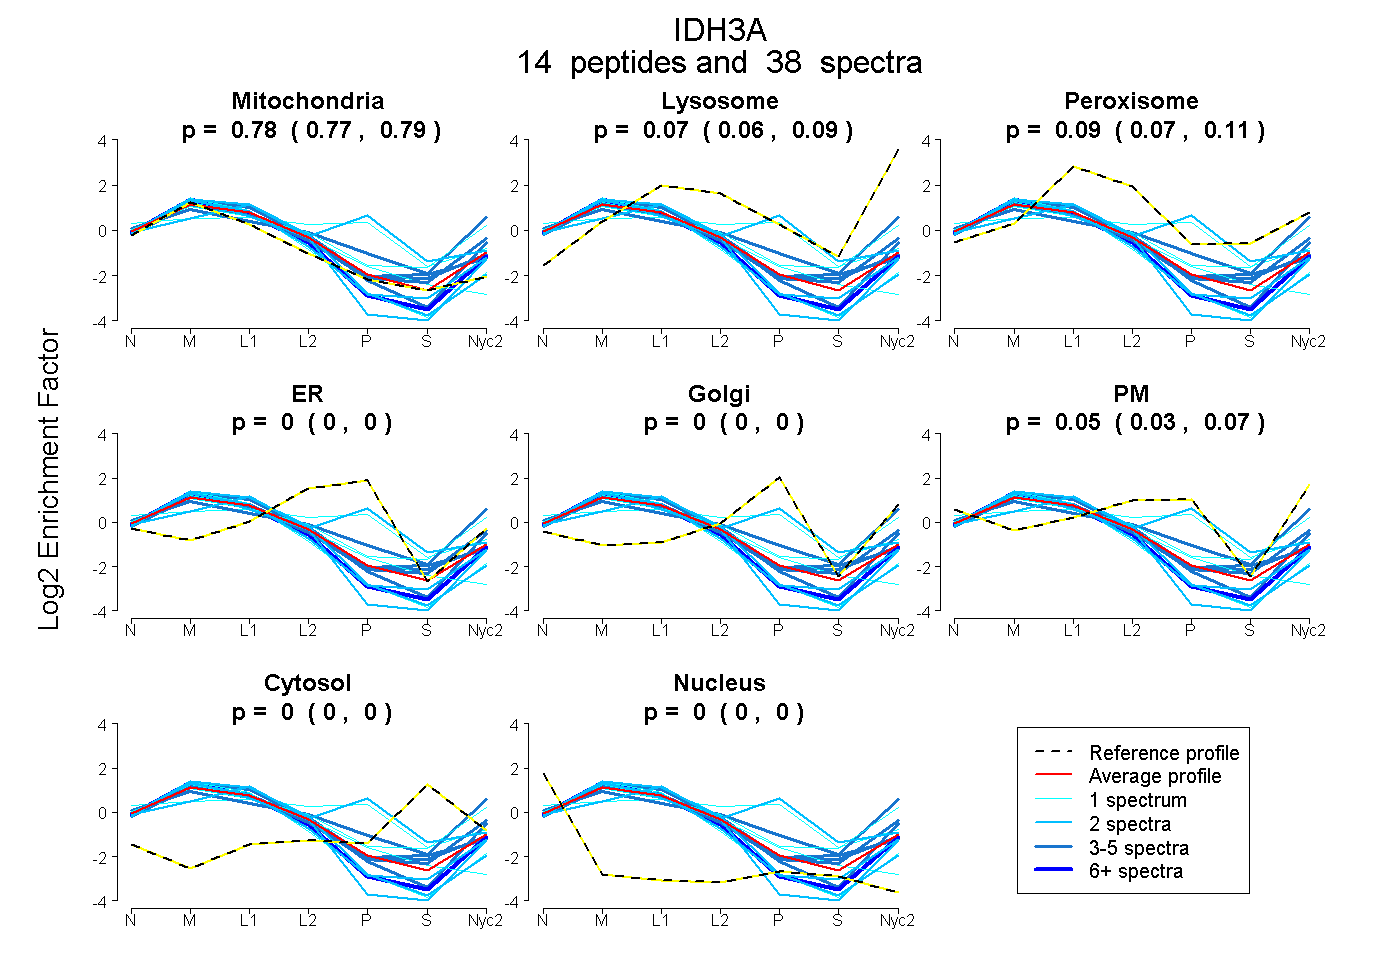 |
0.781
0.768 | 0.791 |
0.075
0.055 | 0.093 |
|
0.091
0.070 | 0.107 |
0.000
0.000 | 0.000 |
0.000
0.000 | 0.000 |
0.053
0.034 | 0.069 |
0.000
0.000 | 0.000 |
0.000
0.000 | 0.000 |
|
| | | Plot |
Mito |
|
Lyso or Perox |
|
ER |
Golgi |
PM |
Cytosol |
Nucleus |
|
| Expt B |
9
peptides |
24
spectra |
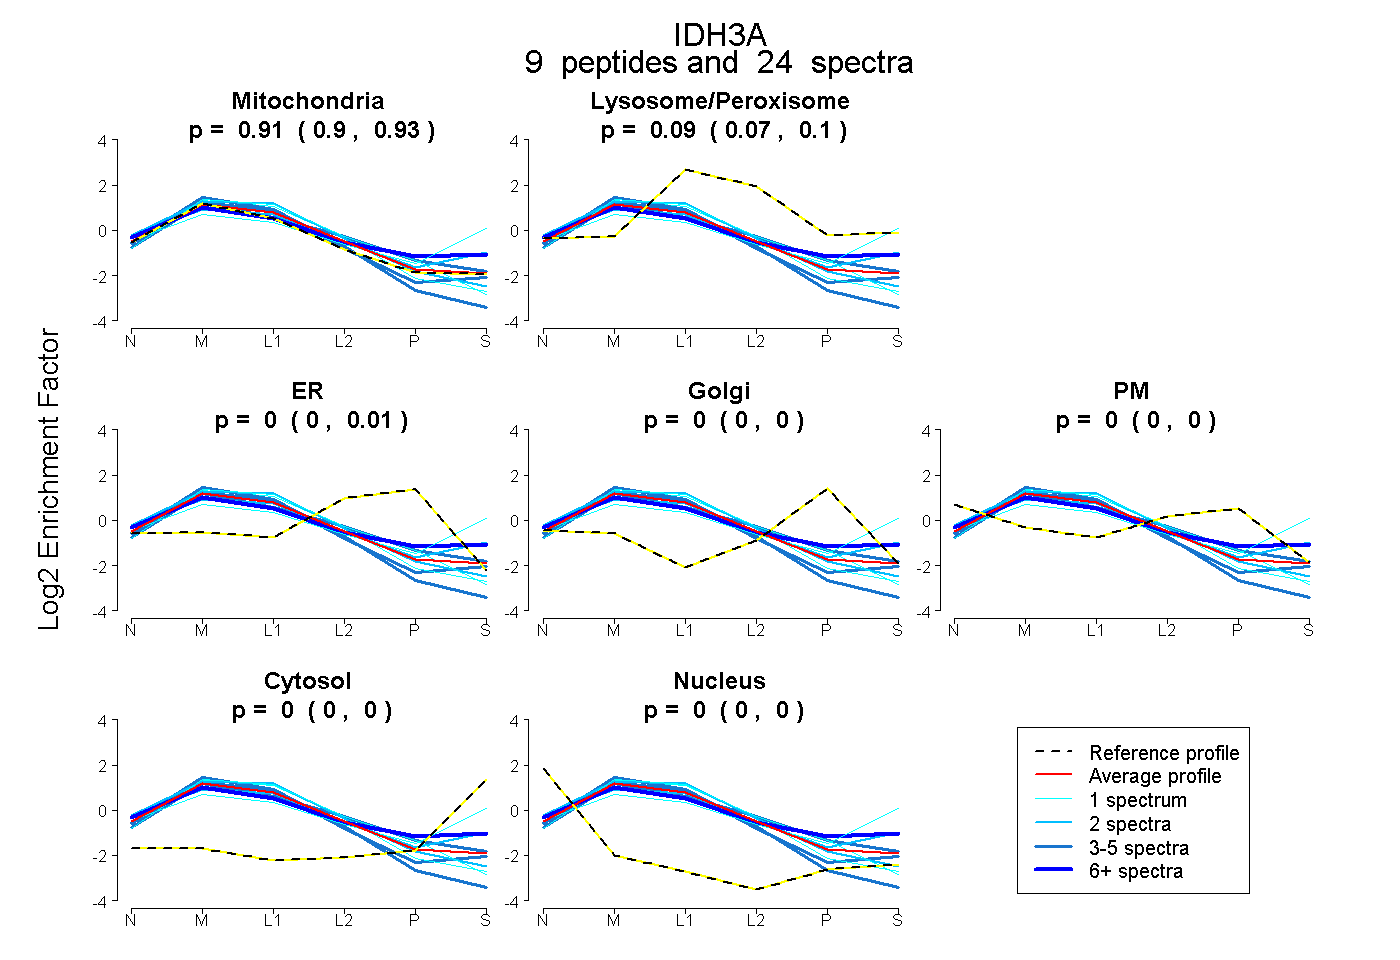 |
0.914
0.898 | 0.926 |
|
0.086
0.071 | 0.098 |
|
0.000
0.000 | 0.008 |
0.000
0.000 | 0.000 |
0.000
0.000 | 0.000 |
0.000
0.000 | 0.000 |
0.000
0.000 | 0.000 |
|
| | | Plot |
|
Lyso |
|
|
|
|
|
|
|
Other |
| Expt C |
18
peptides |
306
spectra |
 |
|
0.000
0.000 | 0.000 |
|
|
|
|
|
|
|
1.000
1.000 | 1.000 |
| | | Plot |
|
Lyso |
|
|
|
|
|
|
|
Other |
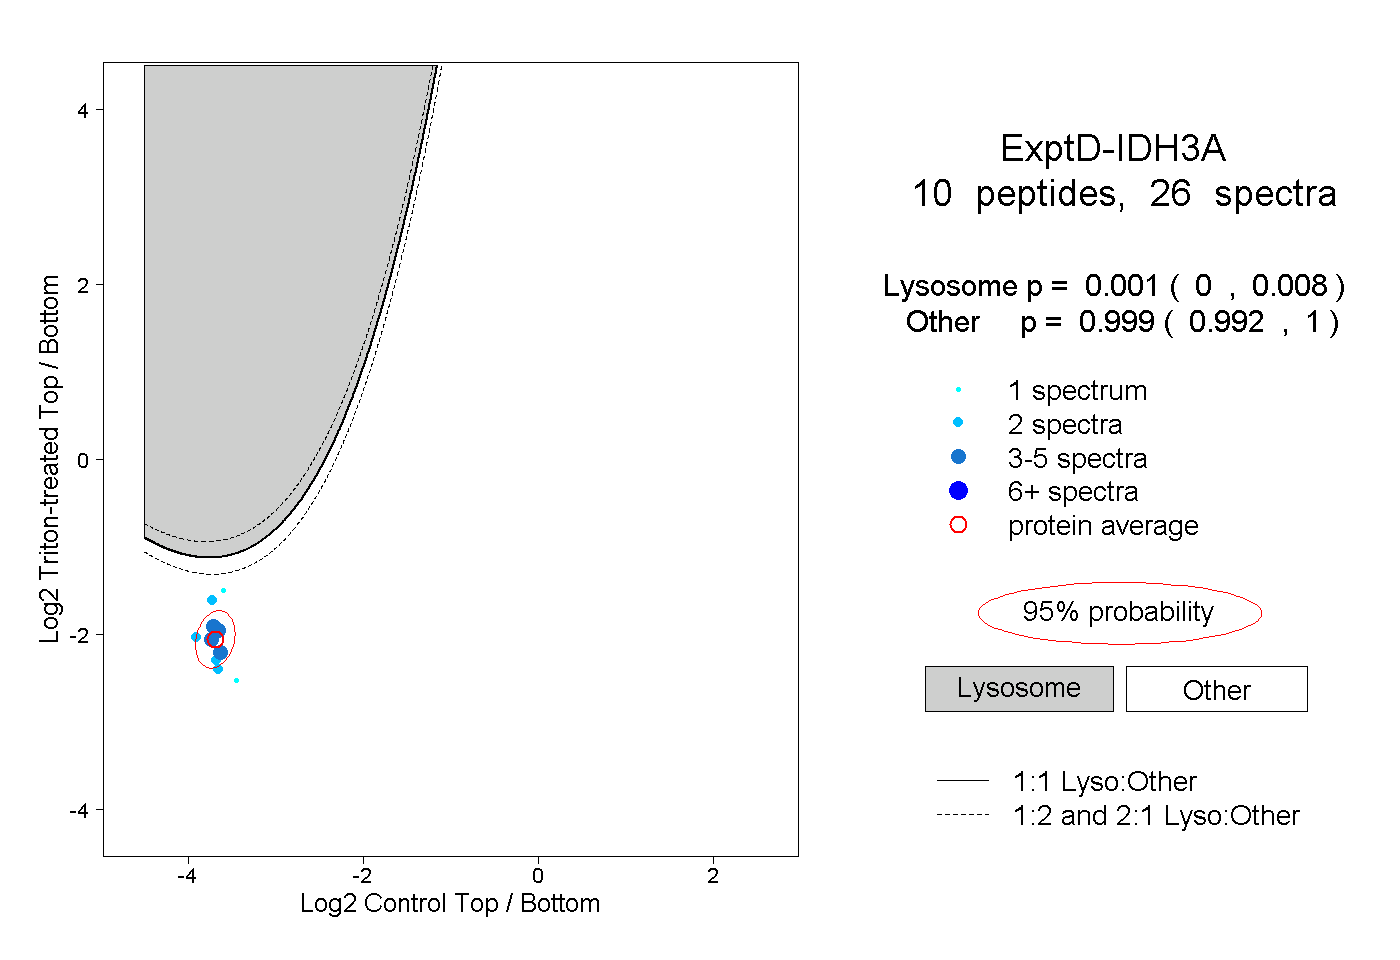
| Expt D |
10
peptides |
26
spectra |
 |
|
0.001
0.000 | 0.008 |
|
|
|
|
|
|
|
0.999
0.992 | 1.000 |
| 2 spectra, IAEFAFEYAR |
|
0.001 |
|
|
|
|
|
|
|
0.999 |
| 2 spectra, HMGLFDHAAK |
|
0.000 |
|
|
|
|
|
|
|
1.000 |
| 4 spectra, LITEGASK |
|
0.001 |
|
|
|
|
|
|
|
0.999 |
| 2 spectra, IEAACFATIK |
|
0.027 |
|
|
|
|
|
|
|
0.973 |
| 1 spectrum, EVAENCK |
|
0.058 |
|
|
|
|
|
|
|
0.942 |
| 3 spectra, IFDAAK |
|
0.002 |
|
|
|
|
|
|
|
0.998 |
| 1 spectrum, DLGGNSK |
|
0.000 |
|
|
|
|
|
|
|
1.000 |
| 4 spectra, APIQWEER |
|
0.003 |
|
|
|
|
|
|
|
0.997 |
| 5 spectra, SNVTAVHK |
|
0.000 |
|
|
|
|
|
|
|
1.000 |
| 2 spectra, MSDGLFLQK |
|
0.000 |
|
|
|
|
|
|
|
1.000 |