 14
14peptides
spectra
0.768 | 0.791
0.055 | 0.093
0.070 | 0.107
0.000 | 0.000
0.000 | 0.000
0.034 | 0.069
0.000 | 0.000
0.000 | 0.000
| Plot | Mito | Lyso | Perox | ER | Golgi | PM | Cytosol | Nucleus | |||||
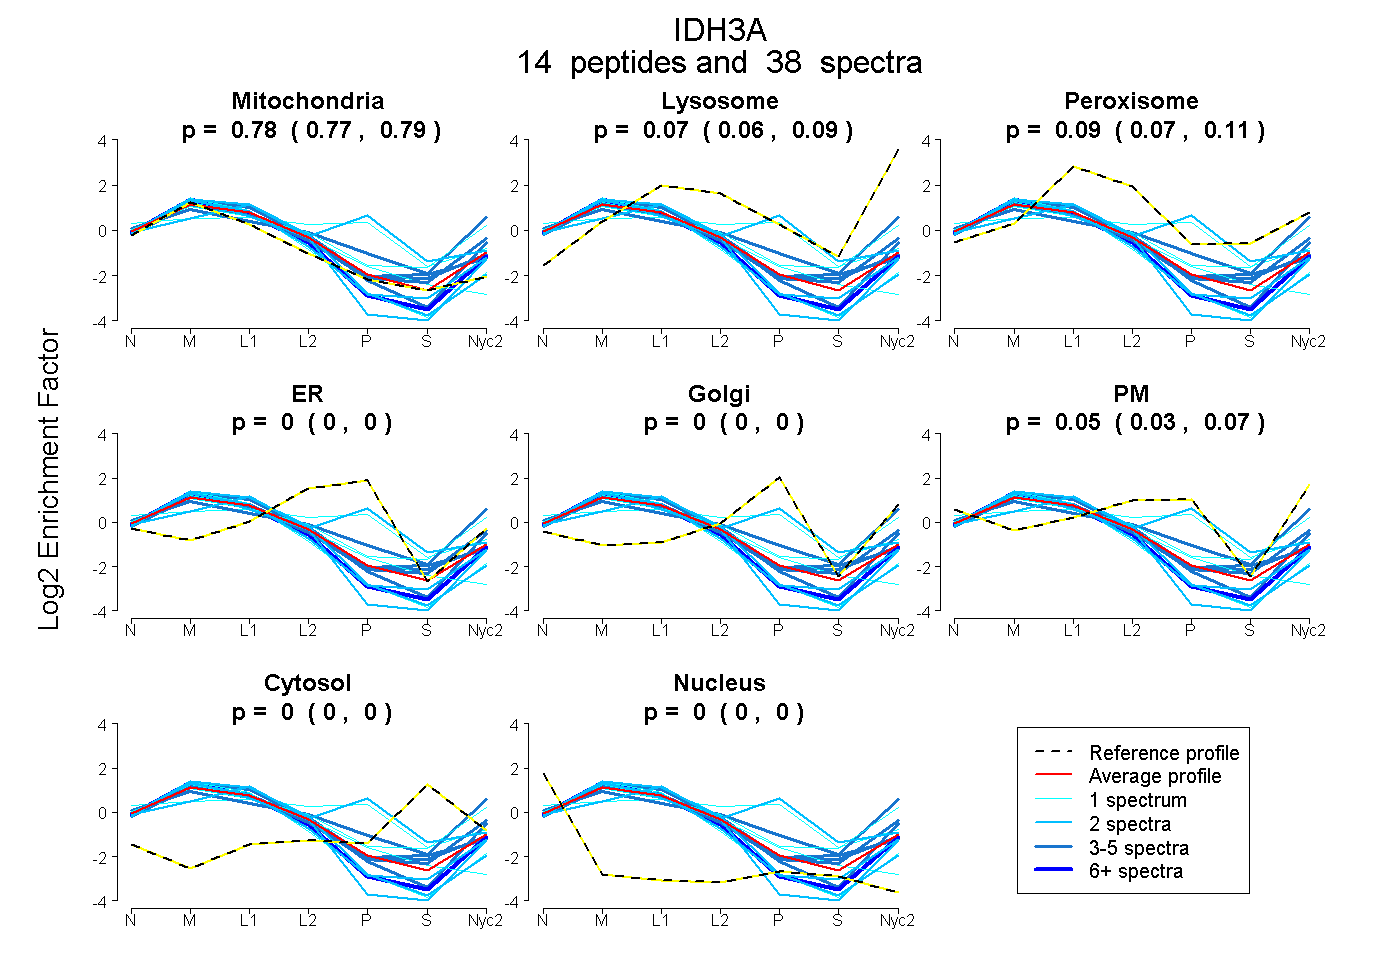
| Expt A |
14 peptides |
38 spectra |
|
0.781 0.768 | 0.791 |
0.075 0.055 | 0.093 |
0.091 0.070 | 0.107 |
0.000 0.000 | 0.000 |
0.000 0.000 | 0.000 |
0.053 0.034 | 0.069 |
0.000 0.000 | 0.000 |
0.000 0.000 | 0.000 |
| 6 spectra, IAEFAFEYAR | 0.929 | 0.071 | 0.000 | 0.000 | 0.000 | 0.000 | 0.000 | 0.000 | ||
| 5 spectra, CSDFTEEICR | 0.750 | 0.000 | 0.239 | 0.000 | 0.000 | 0.000 | 0.010 | 0.000 | ||
| 2 spectra, TFDLYANVRPCVSIEGYK | 0.949 | 0.000 | 0.051 | 0.000 | 0.000 | 0.000 | 0.000 | 0.000 | ||
| 3 spectra, HMGLFDHAAK | 0.801 | 0.190 | 0.000 | 0.000 | 0.000 | 0.009 | 0.000 | 0.000 | ||
| 3 spectra, LITEGASK | 0.753 | 0.233 | 0.000 | 0.000 | 0.000 | 0.000 | 0.000 | 0.014 | ||
| 1 spectrum, IEAACFATIK | 0.901 | 0.000 | 0.032 | 0.067 | 0.000 | 0.000 | 0.000 | 0.000 | ||
| 2 spectra, NVTAIQGPGGK | 0.990 | 0.010 | 0.000 | 0.000 | 0.000 | 0.000 | 0.000 | 0.000 | ||
| 5 spectra, IFDAAK | 0.486 | 0.269 | 0.000 | 0.000 | 0.000 | 0.221 | 0.000 | 0.024 | ||
| 1 spectrum, DLGGNSK | 0.347 | 0.000 | 0.222 | 0.259 | 0.159 | 0.003 | 0.000 | 0.011 | ||
| 2 spectra, TPYTDVNIVTIR | 0.924 | 0.068 | 0.009 | 0.000 | 0.000 | 0.000 | 0.000 | 0.000 | ||
| 2 spectra, TPIAAGHPSMNLLLR | 0.347 | 0.000 | 0.285 | 0.106 | 0.258 | 0.000 | 0.004 | 0.000 | ||
| 4 spectra, APIQWEER | 0.786 | 0.053 | 0.161 | 0.000 | 0.000 | 0.000 | 0.000 | 0.000 | ||
| 1 spectrum, SNVTAVHK | 1.000 | 0.000 | 0.000 | 0.000 | 0.000 | 0.000 | 0.000 | 0.000 | ||
| 1 spectrum, MSDGLFLQK | 0.552 | 0.310 | 0.068 | 0.000 | 0.000 | 0.027 | 0.000 | 0.044 |
| Plot | Mito | Lyso or Perox | ER | Golgi | PM | Cytosol | Nucleus | ||||||
| Expt B |
9 peptides |
24 spectra |
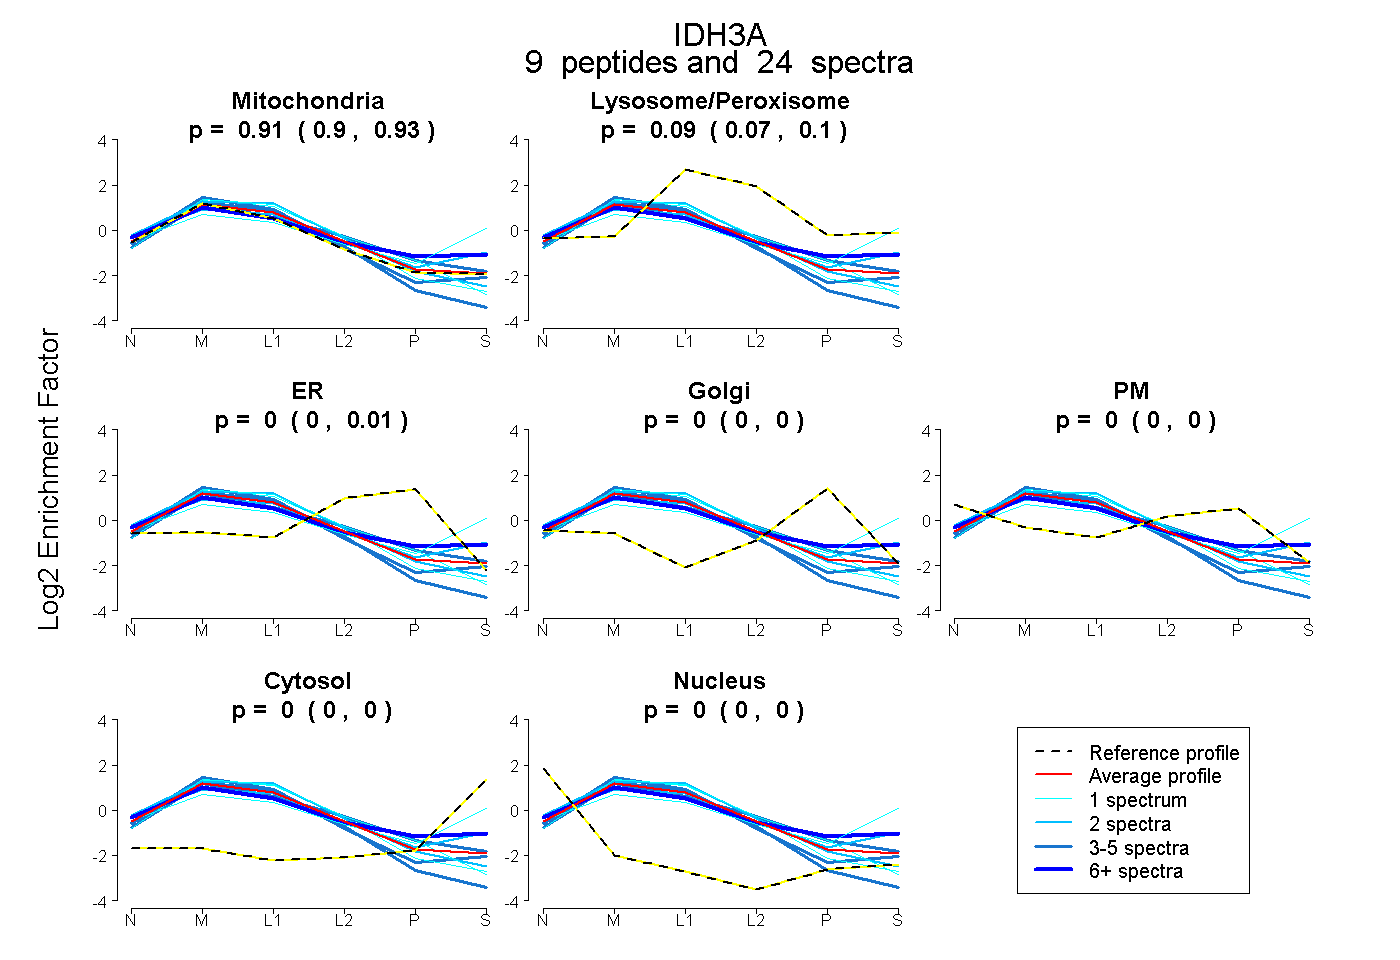 |
0.914 0.898 | 0.926 |
0.086 0.071 | 0.098 |
0.000 0.000 | 0.008 |
0.000 0.000 | 0.000 |
0.000 0.000 | 0.000 |
0.000 0.000 | 0.000 |
0.000 0.000 | 0.000 |
|||
| Plot | Lyso | Other | |||||||||||
| Expt C |
18 peptides |
306 spectra |
 |
0.000 0.000 | 0.000 |
1.000 1.000 | 1.000 |
||||||||
| Plot | Lyso | Other | |||||||||||
| Expt D |
10 peptides |
26 spectra |
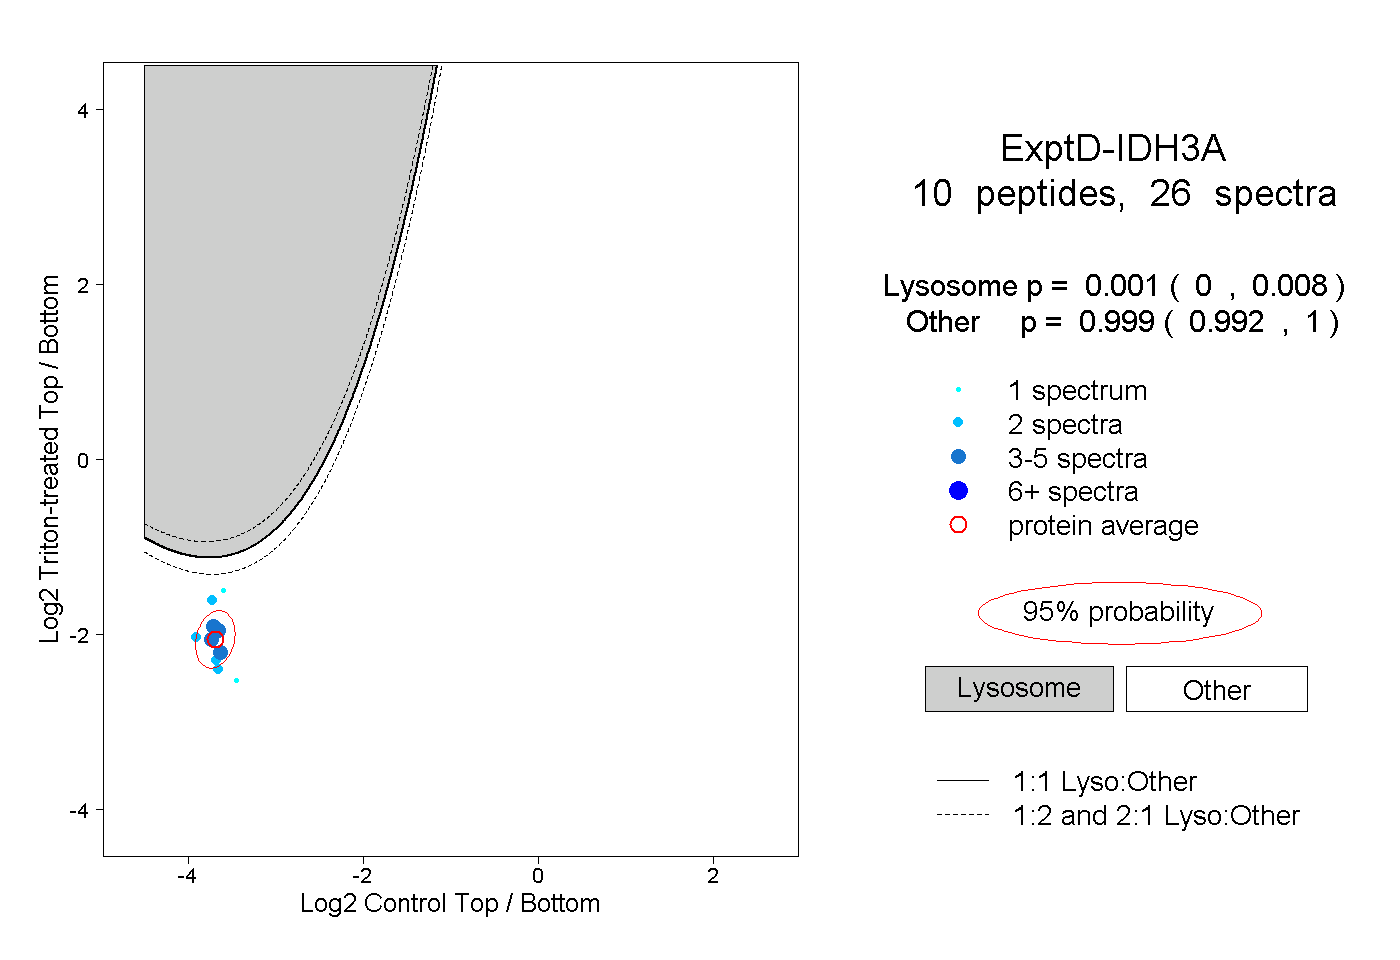 |
0.001 0.000 | 0.008 |
0.999 0.992 | 1.000 |