 10
10peptides
spectra

0.000 | 0.000
0.599 | 0.630
0.000 | 0.000
0.000 | 0.036
0.166 | 0.214
0.145 | 0.205
0.000 | 0.000
0.000 | 0.000
4peptides
spectra
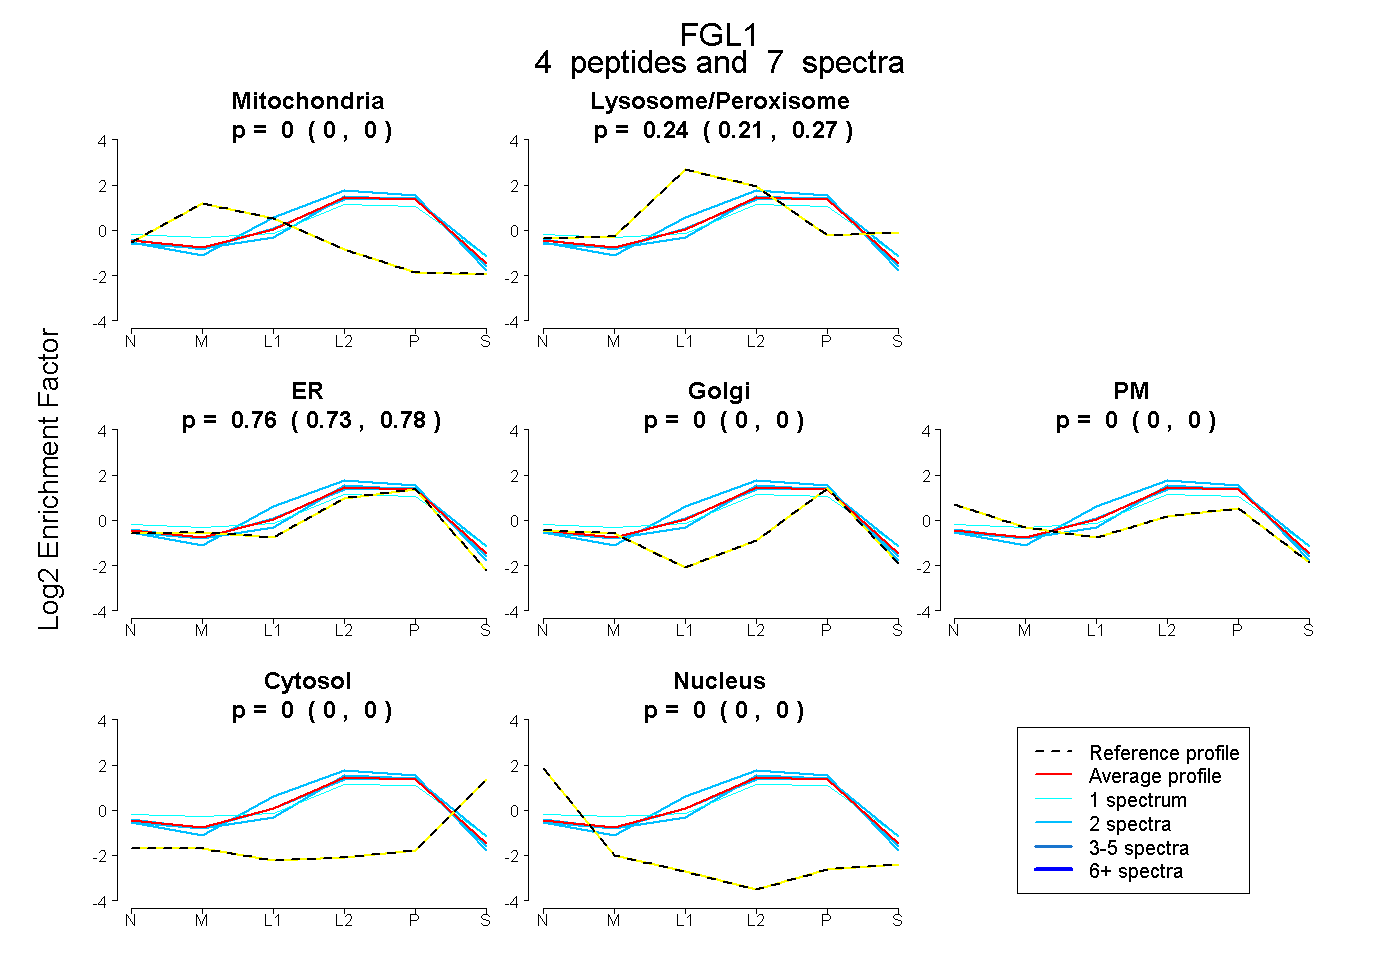
0.000 | 0.000
0.214 | 0.266
0.730 | 0.781
0.000 | 0.000
0.000 | 0.000
0.000 | 0.000
0.000 | 0.000
11peptides
spectra
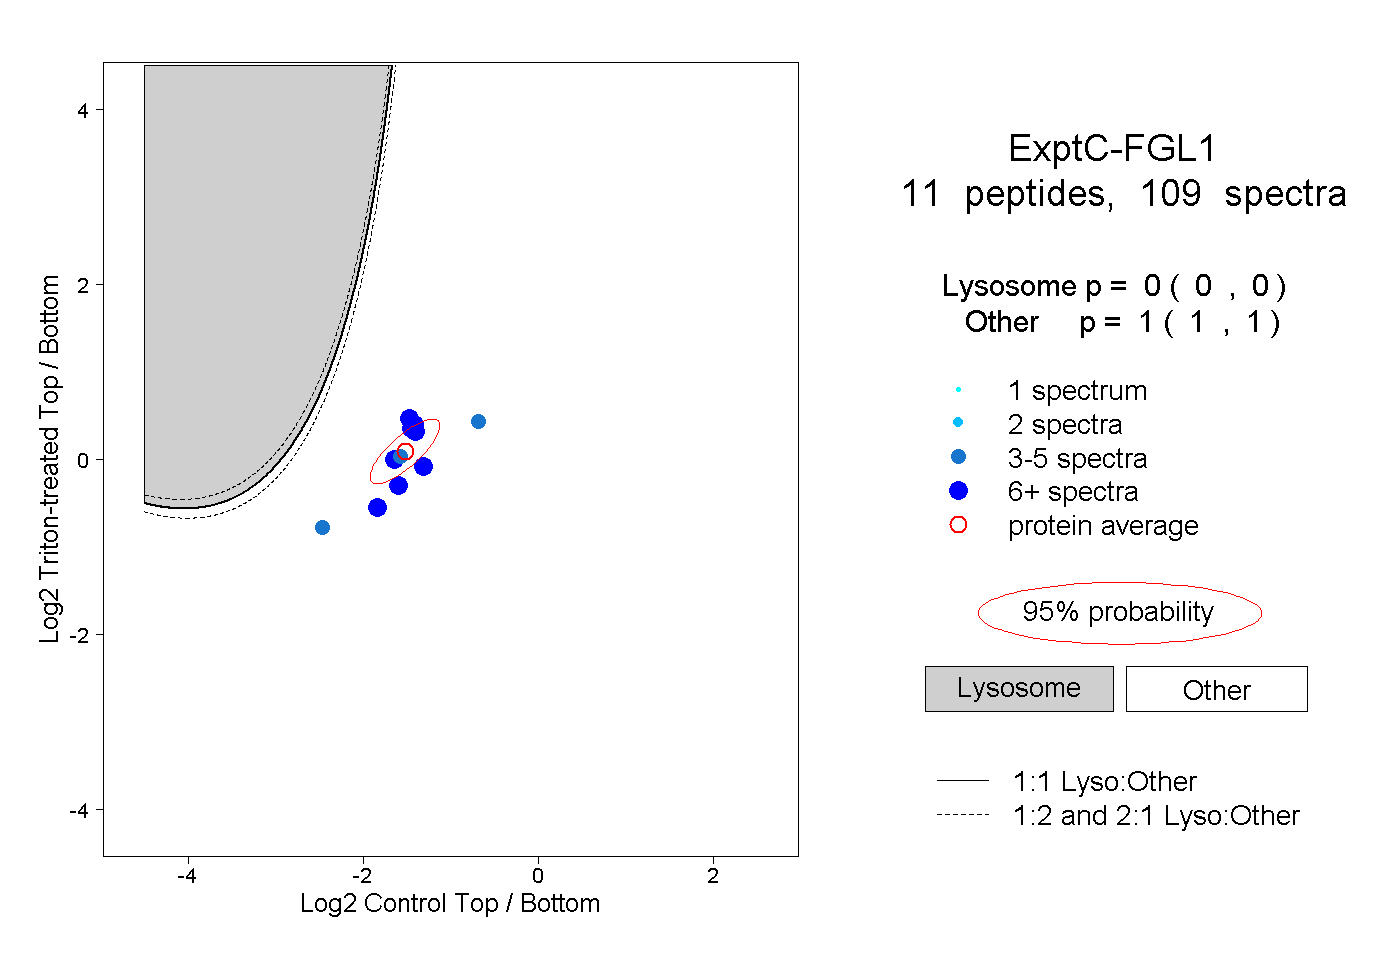
0.000 | 0.000
1.000 | 1.000
5peptides
spectra

0.000 | 0.003
0.997 | 1.000