FGL1
[ENSRNOP00000014248]
Main page
| | | Plot |
Mito |
Lyso |
|
Perox |
ER |
Golgi |
PM |
Cytosol |
Nucleus |
|
| Expt A |
 10
10
peptides |
22
spectra |
 |
0.000
0.000 | 0.000 |
0.616
0.599 | 0.630 |
|
0.000
0.000 | 0.000 |
0.010
0.000 | 0.036 |
0.195
0.166 | 0.214 |
0.180
0.145 | 0.205 |
0.000
0.000 | 0.000 |
0.000
0.000 | 0.000 |
|
| | | Plot |
Mito |
|
Lyso or Perox |
|
ER |
Golgi |
PM |
Cytosol |
Nucleus |
|
| Expt B |
4
peptides |
7
spectra |
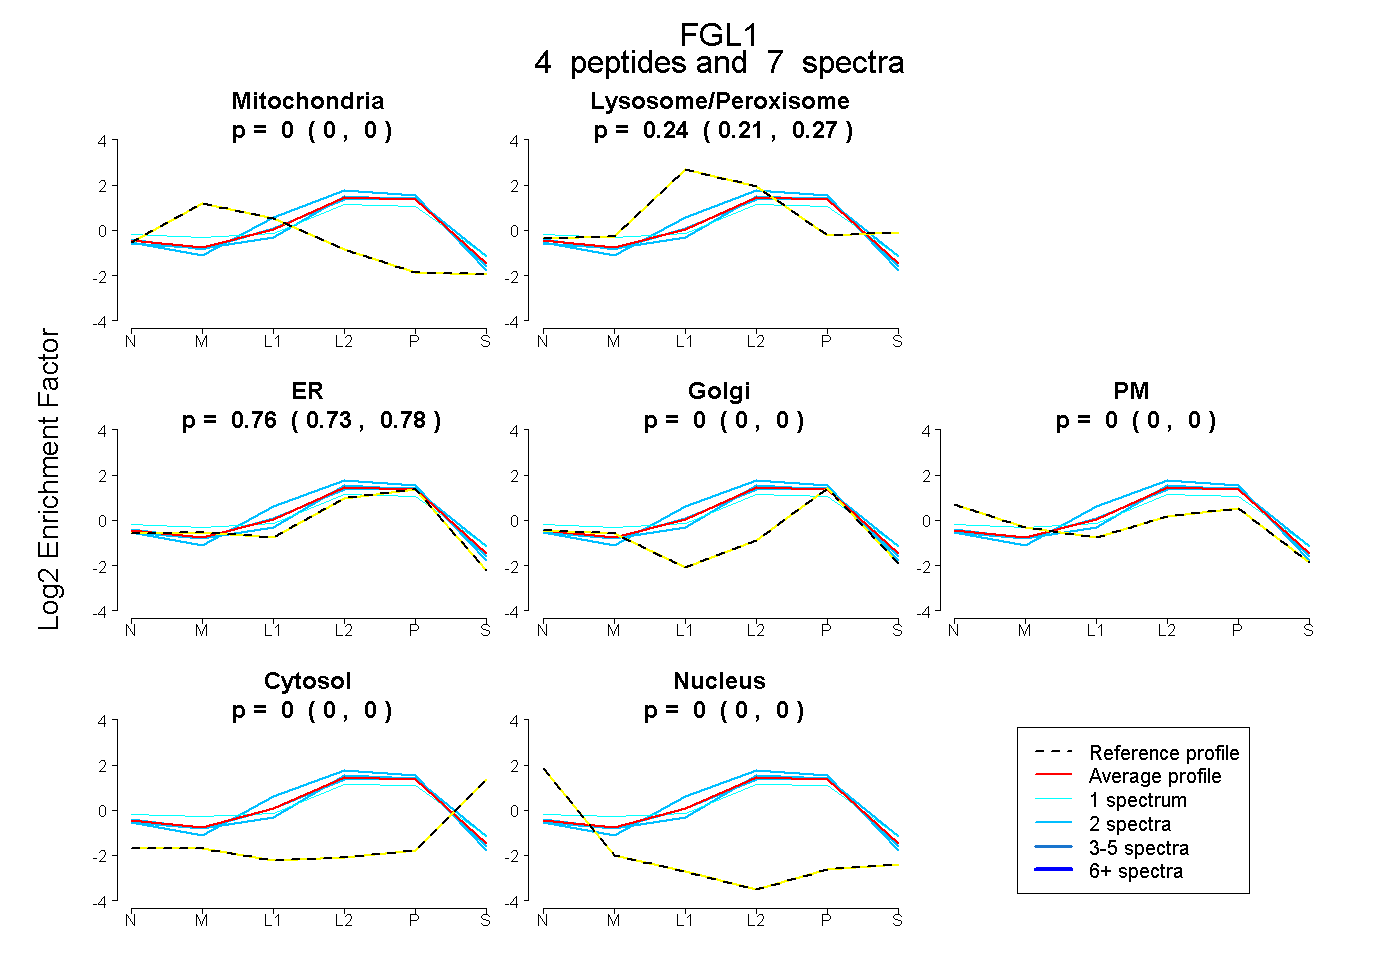 |
0.000
0.000 | 0.000 |
|
0.242
0.214 | 0.266 |
|
0.758
0.730 | 0.781 |
0.000
0.000 | 0.000 |
0.000
0.000 | 0.000 |
0.000
0.000 | 0.000 |
0.000
0.000 | 0.000 |
|
| 2 spectra, EVQFLDR |
0.000 |
|
0.207 |
|
0.769 |
0.000 |
0.000 |
0.024 |
0.000 |
|
| 2 spectra, IDLTDFEK |
0.000 |
|
0.297 |
|
0.703 |
0.000 |
0.000 |
0.000 |
0.000 |
|
| 2 spectra, SDGSENFNR |
0.000 |
|
0.218 |
|
0.782 |
0.000 |
0.000 |
0.000 |
0.000 |
|
| 1 spectrum, IRPSDFIPNIV |
0.000 |
|
0.282 |
|
0.483 |
0.118 |
0.118 |
0.000 |
0.000 |
|
| | | Plot |
|
Lyso |
|
|
|
|
|
|
|
Other |
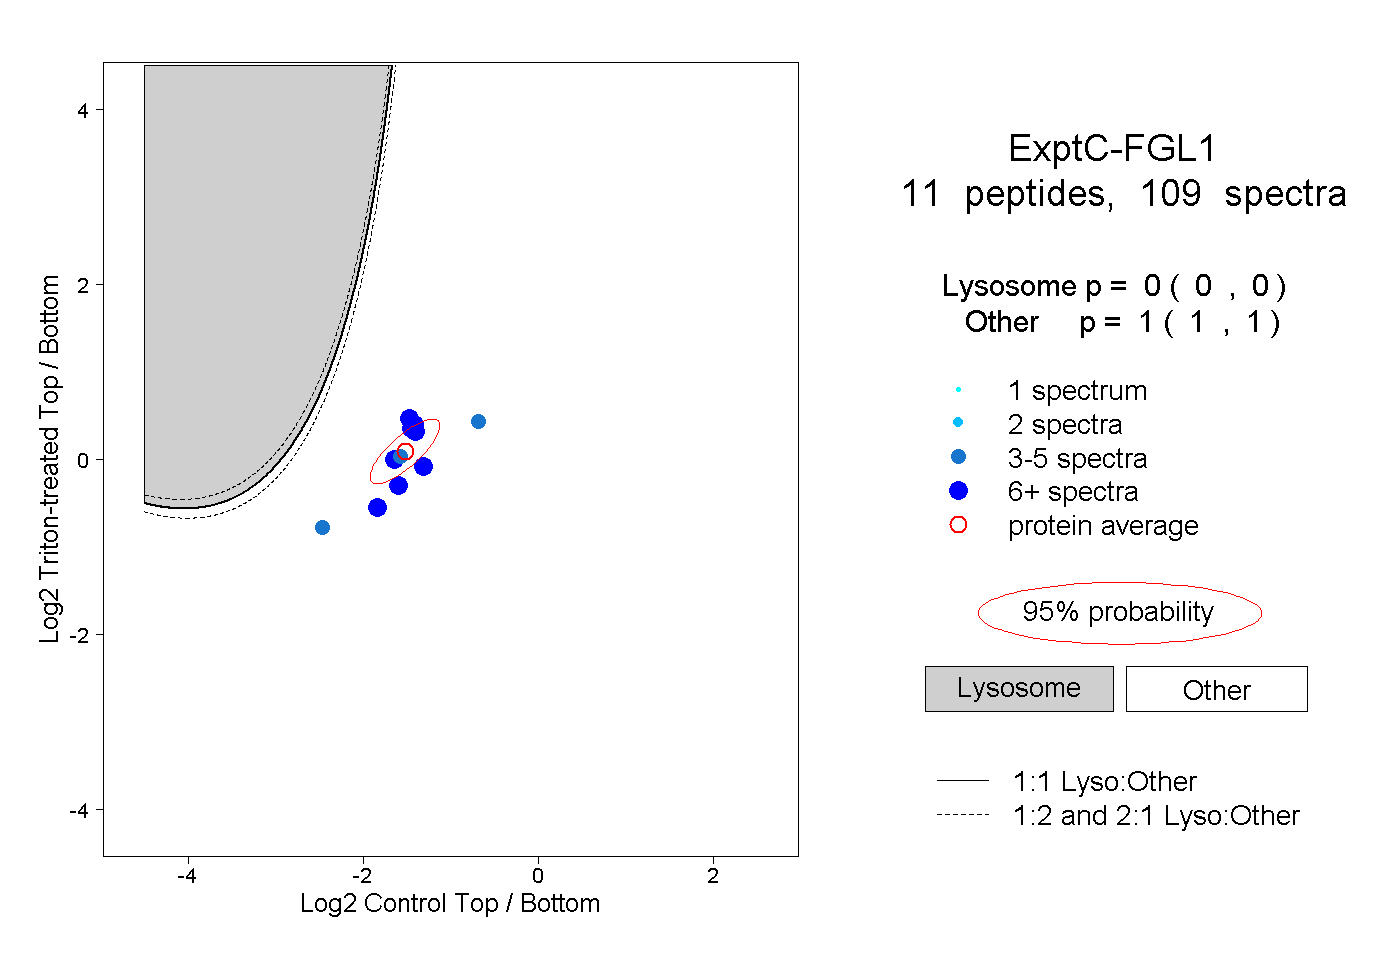
| Expt C |
11
peptides |
109
spectra |
 |
|
0.000
0.000 | 0.000 |
|
|
|
|
|
|
|
1.000
1.000 | 1.000 |
| | | Plot |
|
Lyso |
|
|
|
|
|
|
|
Other |
| Expt D |
5
peptides |
6
spectra |
 |
|
0.000
0.000 | 0.003 |
|
|
|
|
|
|
|
1.000
0.997 | 1.000 |