 10
10peptides
spectra

0.000 | 0.000
0.599 | 0.630
0.000 | 0.000
0.000 | 0.036
0.166 | 0.214
0.145 | 0.205
0.000 | 0.000
0.000 | 0.000
| Plot | Mito | Lyso | Perox | ER | Golgi | PM | Cytosol | Nucleus | |||||
| Expt A |
10 peptides |
22 spectra |
|
0.000 0.000 | 0.000 |
0.616 0.599 | 0.630 |
0.000 0.000 | 0.000 |
0.010 0.000 | 0.036 |
0.195 0.166 | 0.214 |
0.180 0.145 | 0.205 |
0.000 0.000 | 0.000 |
0.000 0.000 | 0.000 |
| 2 spectra, EVQFLDR | 0.000 | 0.486 | 0.000 | 0.177 | 0.126 | 0.211 | 0.000 | 0.000 | ||
| 2 spectra, IDLTDFEK | 0.000 | 0.704 | 0.000 | 0.130 | 0.000 | 0.166 | 0.000 | 0.000 | ||
| 2 spectra, QQQVVIAQLLHEK | 0.000 | 0.623 | 0.000 | 0.210 | 0.152 | 0.015 | 0.000 | 0.000 | ||
| 1 spectrum, AETDNGVVWYTWR | 0.000 | 0.872 | 0.000 | 0.000 | 0.110 | 0.000 | 0.018 | 0.000 | ||
| 2 spectra, SDGSENFNR | 0.000 | 0.562 | 0.000 | 0.029 | 0.073 | 0.335 | 0.000 | 0.000 | ||
| 3 spectra, IRPSDFIPNIV | 0.000 | 0.630 | 0.000 | 0.050 | 0.074 | 0.246 | 0.000 | 0.000 | ||
| 1 spectrum, HYADCSEIYNDGFK | 0.000 | 0.600 | 0.000 | 0.094 | 0.293 | 0.000 | 0.014 | 0.000 | ||
| 1 spectrum, HSGFYK | 0.000 | 0.649 | 0.000 | 0.000 | 0.213 | 0.031 | 0.107 | 0.000 | ||
| 6 spectra, GQEDSFIDLGGK | 0.000 | 0.479 | 0.000 | 0.014 | 0.218 | 0.211 | 0.079 | 0.000 | ||
| 2 spectra, GWWYSLK | 0.000 | 0.719 | 0.000 | 0.000 | 0.169 | 0.112 | 0.000 | 0.000 |
| Plot | Mito | Lyso or Perox | ER | Golgi | PM | Cytosol | Nucleus | ||||||
| Expt B |
4 peptides |
7 spectra |
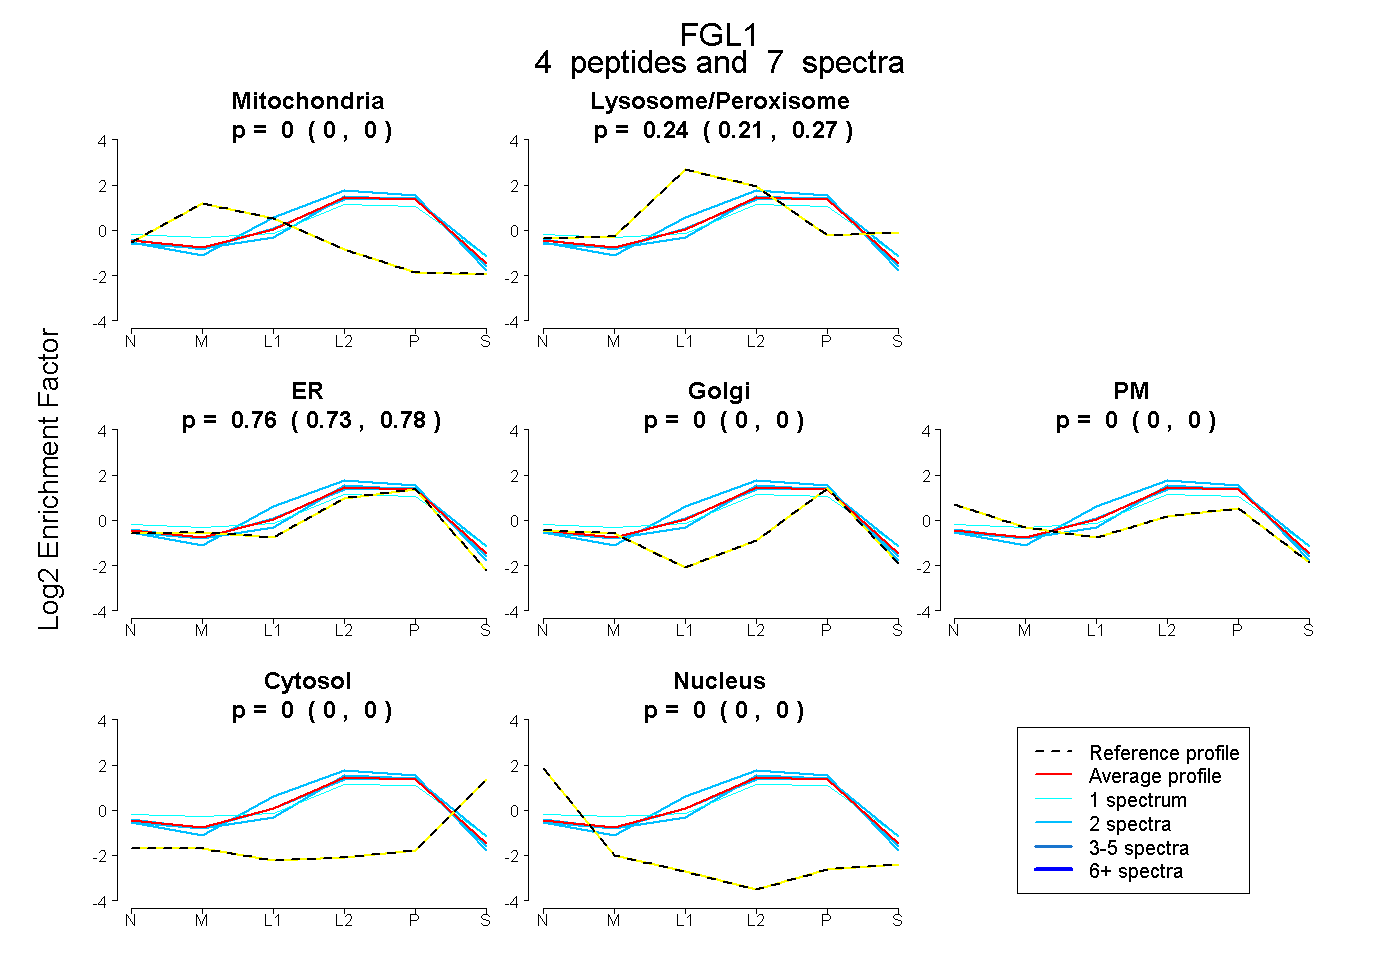 |
0.000 0.000 | 0.000 |
0.242 0.214 | 0.266 |
0.758 0.730 | 0.781 |
0.000 0.000 | 0.000 |
0.000 0.000 | 0.000 |
0.000 0.000 | 0.000 |
0.000 0.000 | 0.000 |
|||
| Plot | Lyso | Other | |||||||||||
| Expt C |
11 peptides |
109 spectra |
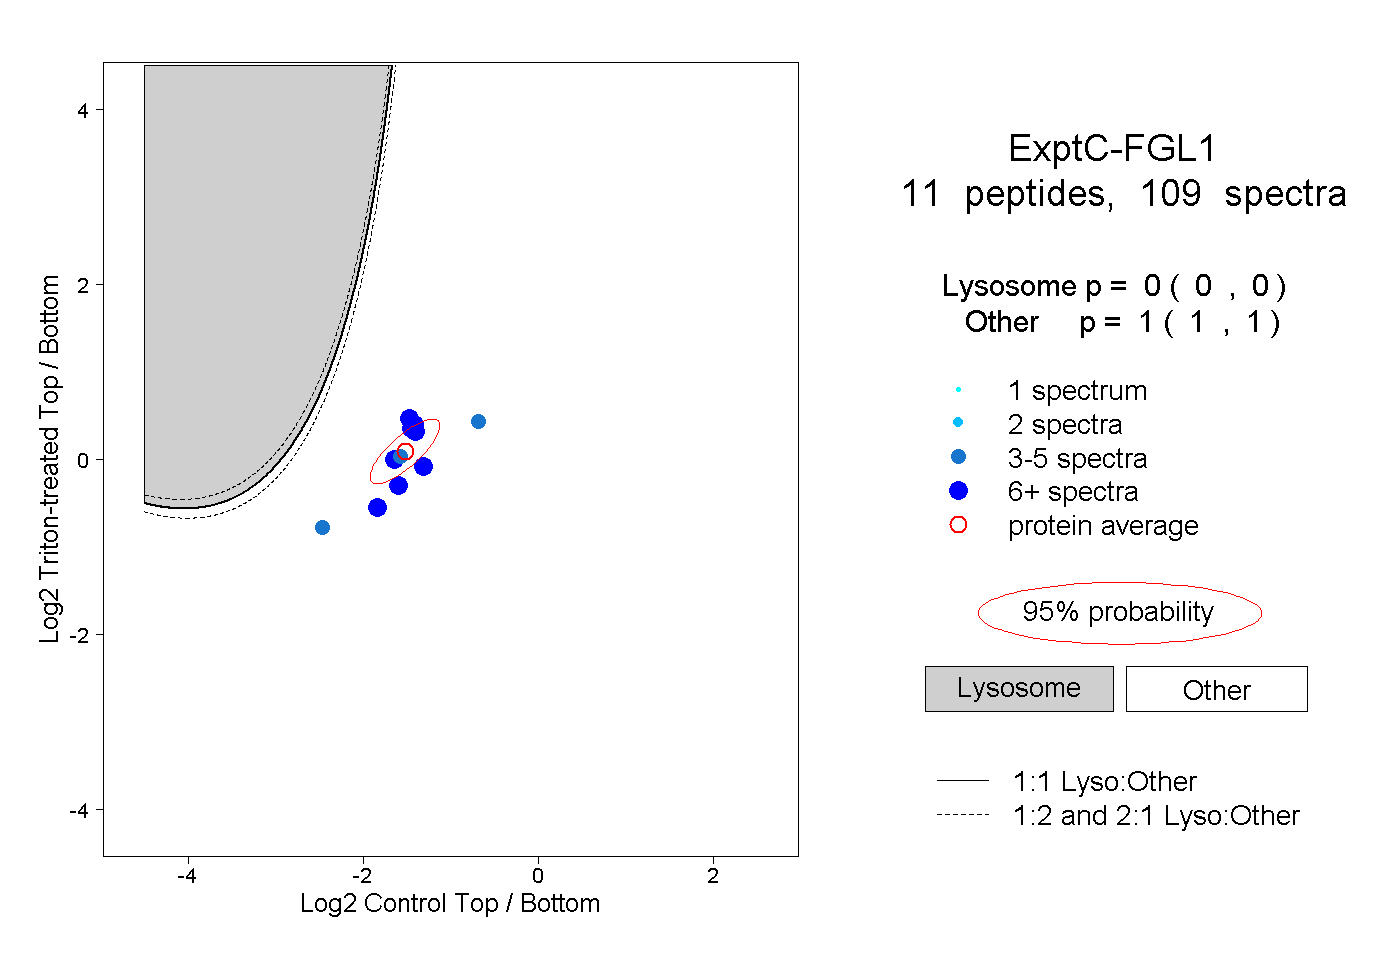 |
0.000 0.000 | 0.000 |
1.000 1.000 | 1.000 |
||||||||
| Plot | Lyso | Other | |||||||||||
| Expt D |
5 peptides |
6 spectra |
 |
0.000 0.000 | 0.003 |
1.000 0.997 | 1.000 |