 10
10peptides
spectra
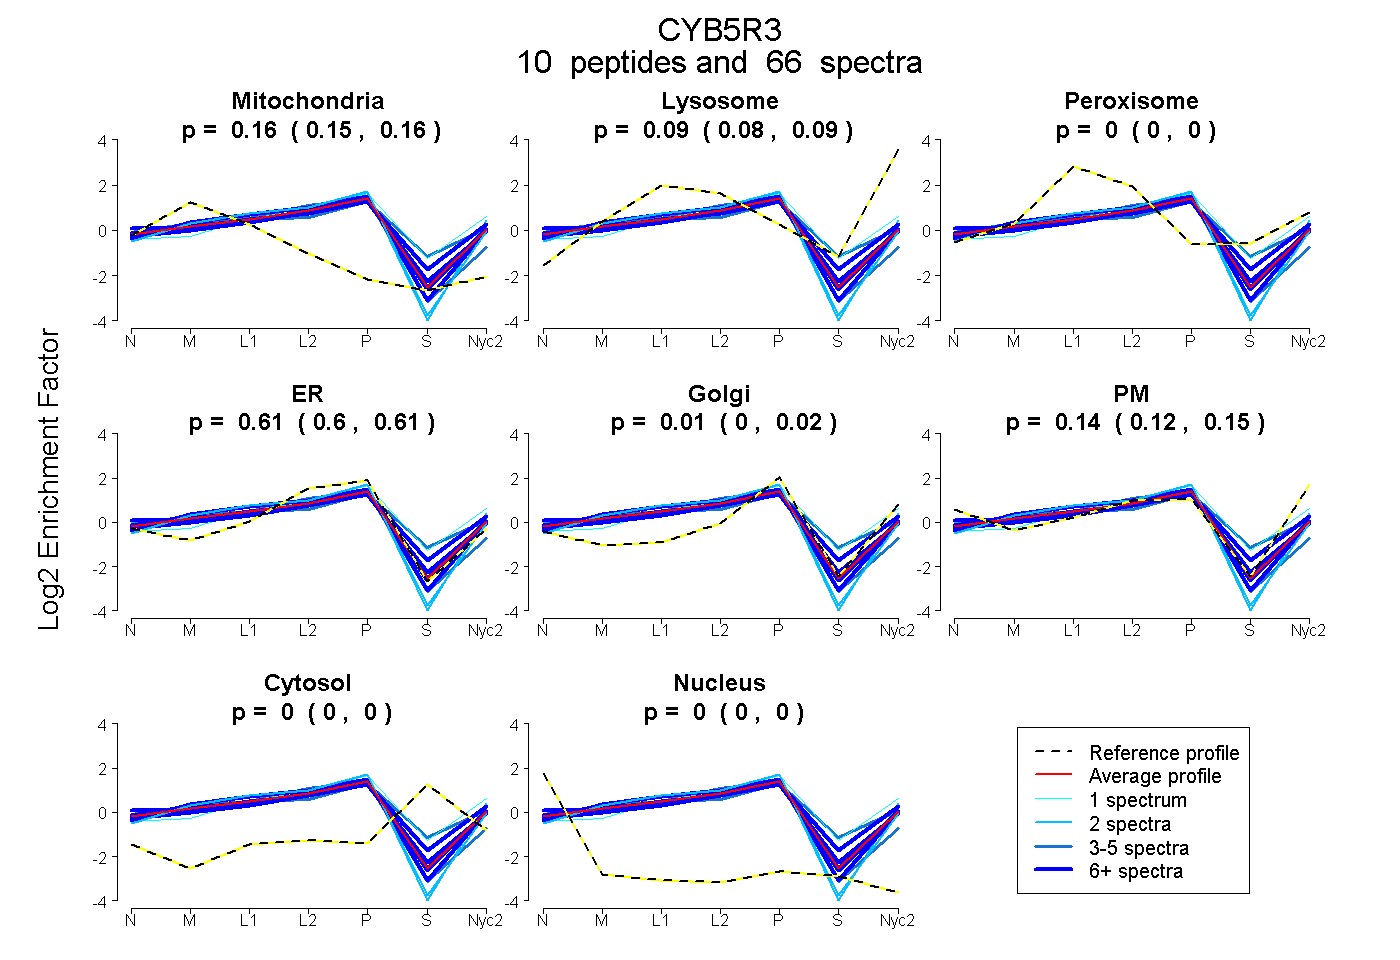
0.155 | 0.159
0.081 | 0.094
0.000 | 0.000
0.603 | 0.615
0.002 | 0.017
0.122 | 0.146
0.000 | 0.000
0.000 | 0.000
6peptides
spectra
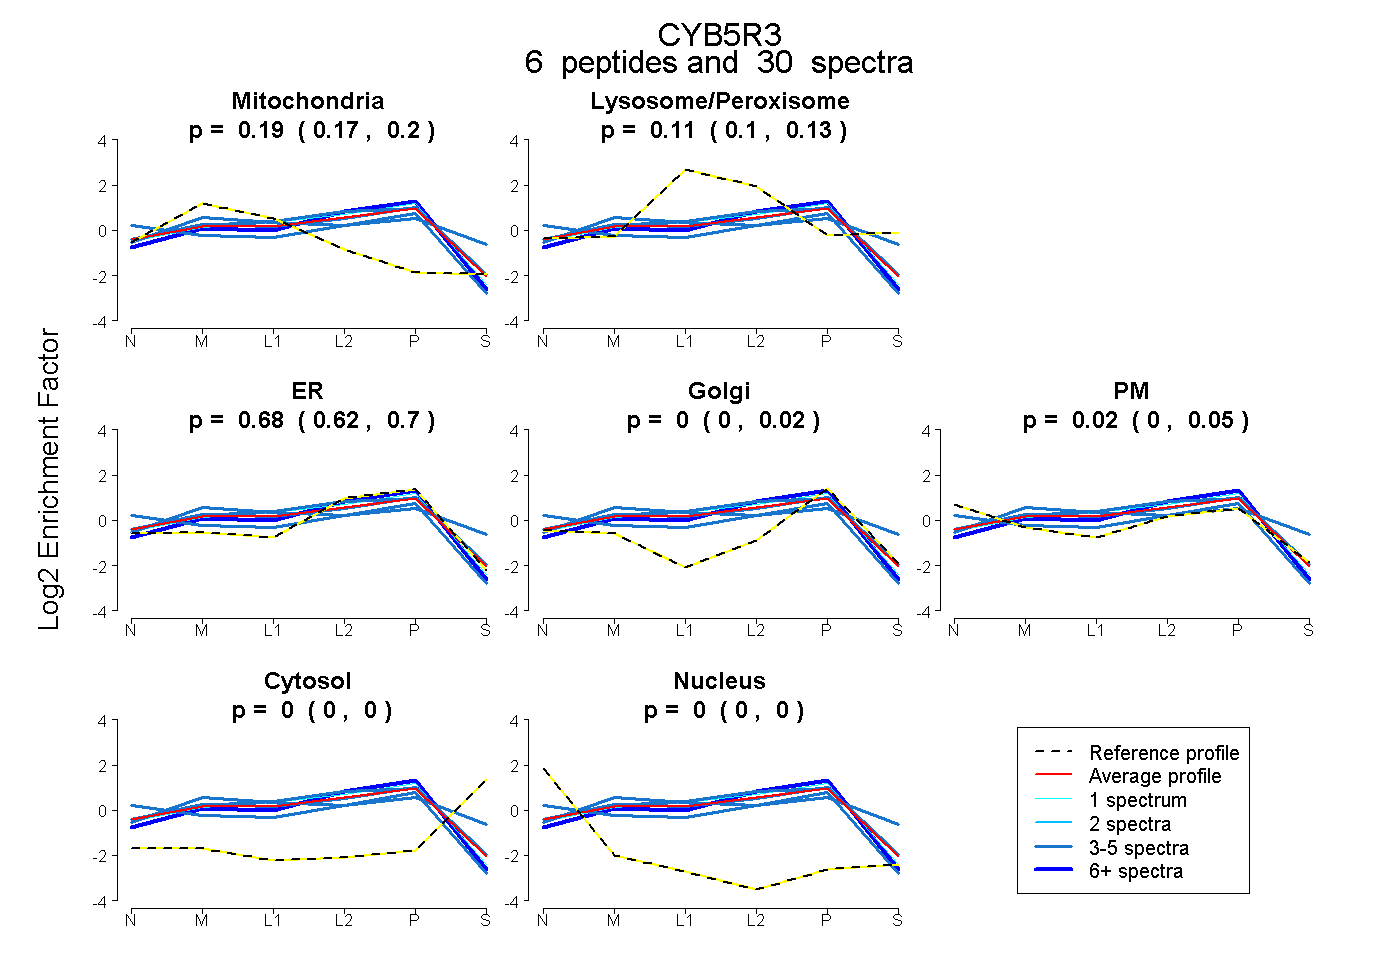
0.166 | 0.200
0.095 | 0.132
0.624 | 0.702
0.000 | 0.018
0.000 | 0.054
0.000 | 0.000
0.000 | 0.000
13peptides
spectra
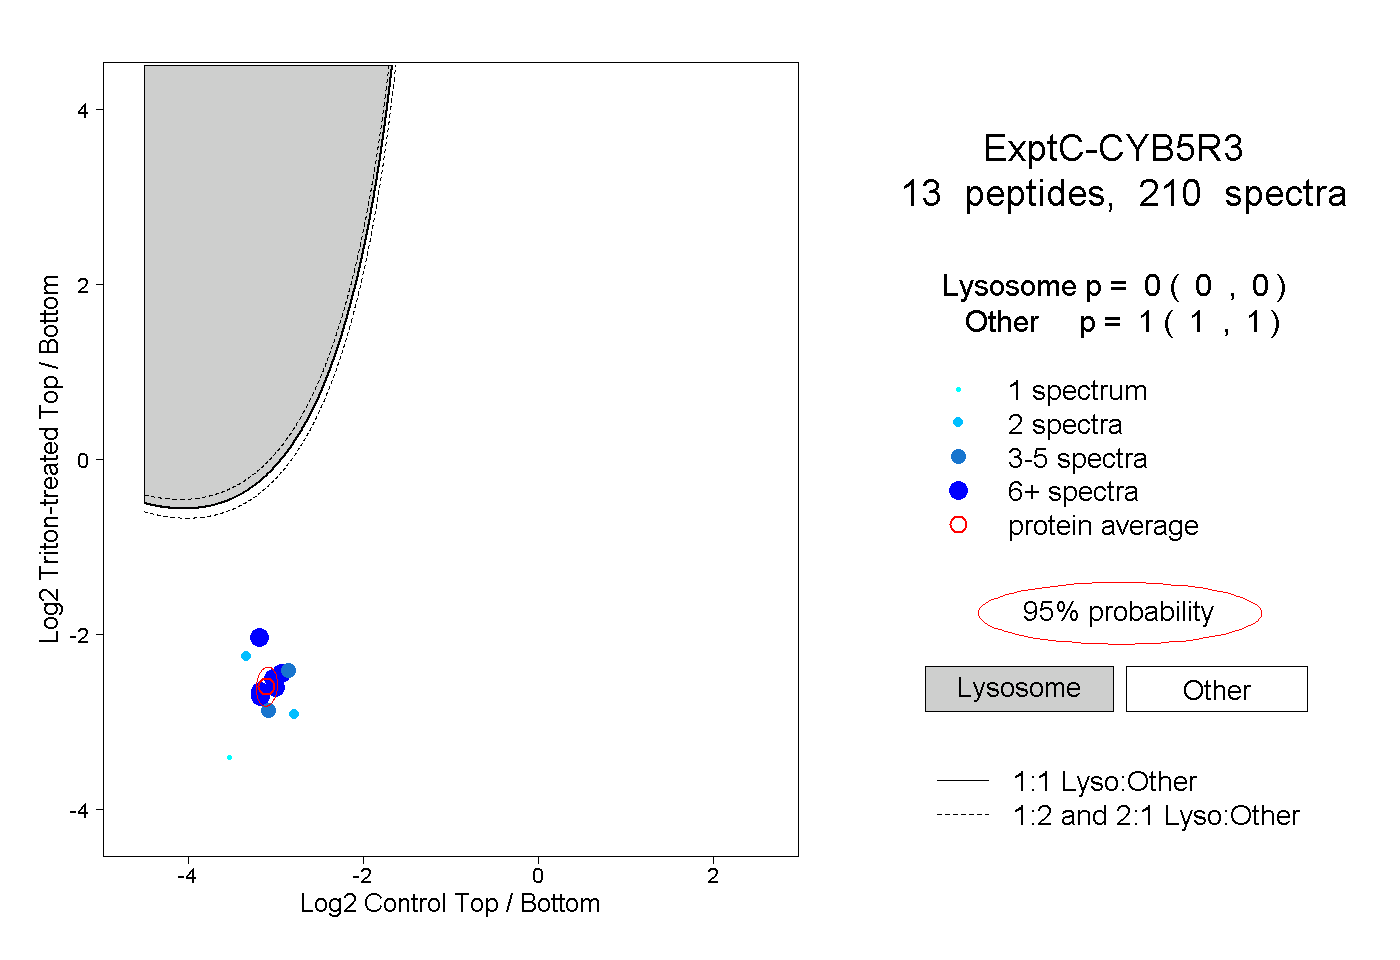
0.000 | 0.000
1.000 | 1.000
4peptides
spectra
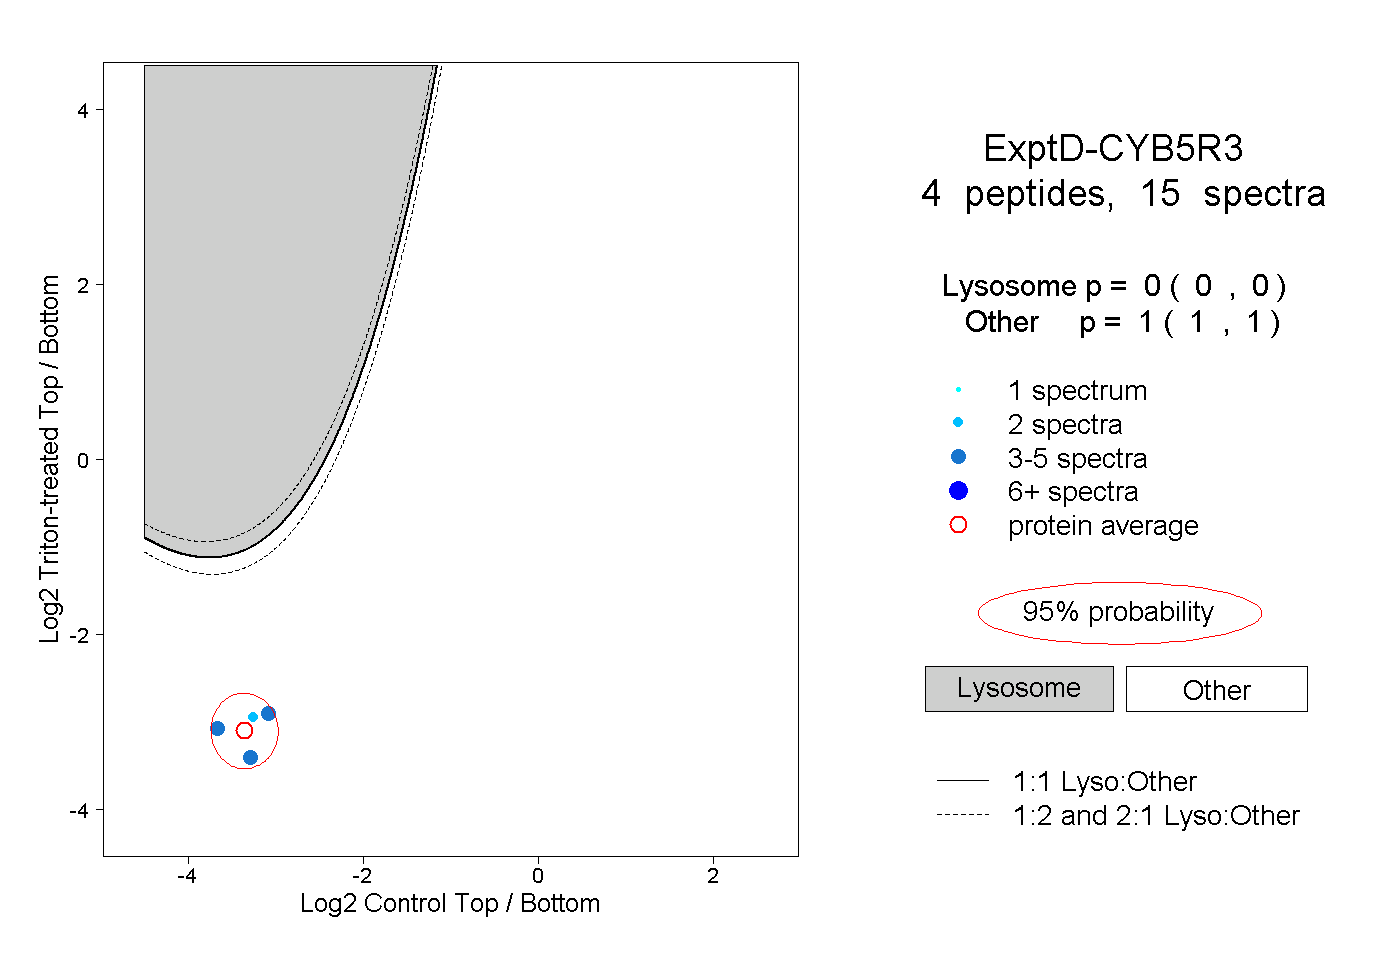
0.000 | 0.000
1.000 | 1.000