CYB5R3
[ENSRNOP00000012878]
Main page
| | | Plot |
Mito |
Lyso |
|
Perox |
ER |
Golgi |
PM |
Cytosol |
Nucleus |
|
| Expt A |
 10
10
peptides |
66
spectra |
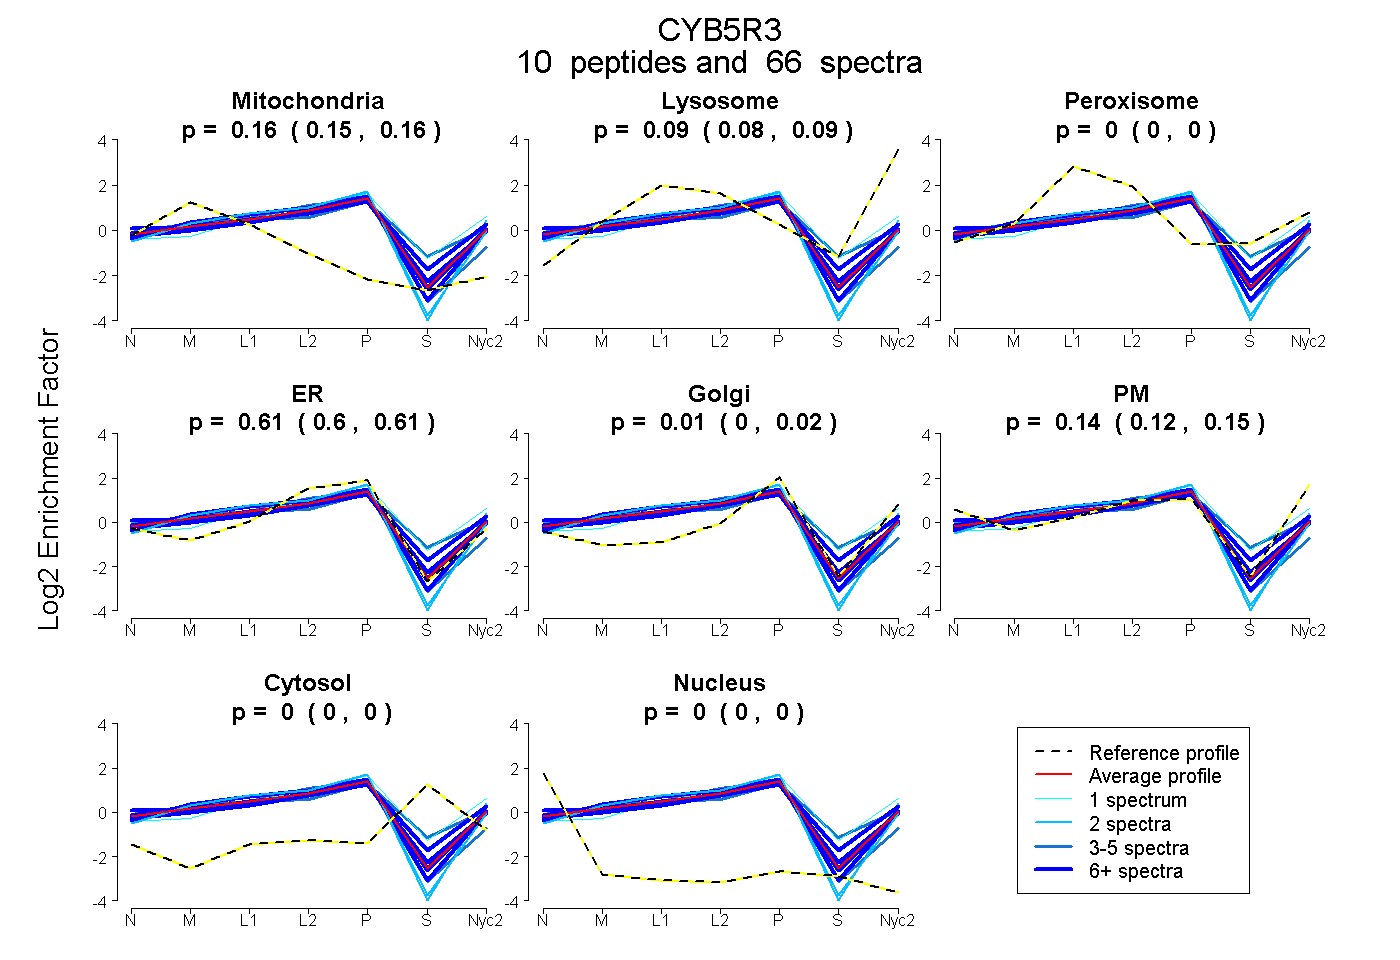 |
0.157
0.155 | 0.159 |
0.088
0.081 | 0.094 |
|
0.000
0.000 | 0.000 |
0.609
0.603 | 0.615 |
0.010
0.002 | 0.017 |
0.135
0.122 | 0.146 |
0.000
0.000 | 0.000 |
0.000
0.000 | 0.000 |
|
| | | Plot |
Mito |
|
Lyso or Perox |
|
ER |
Golgi |
PM |
Cytosol |
Nucleus |
|
| Expt B |
6
peptides |
30
spectra |
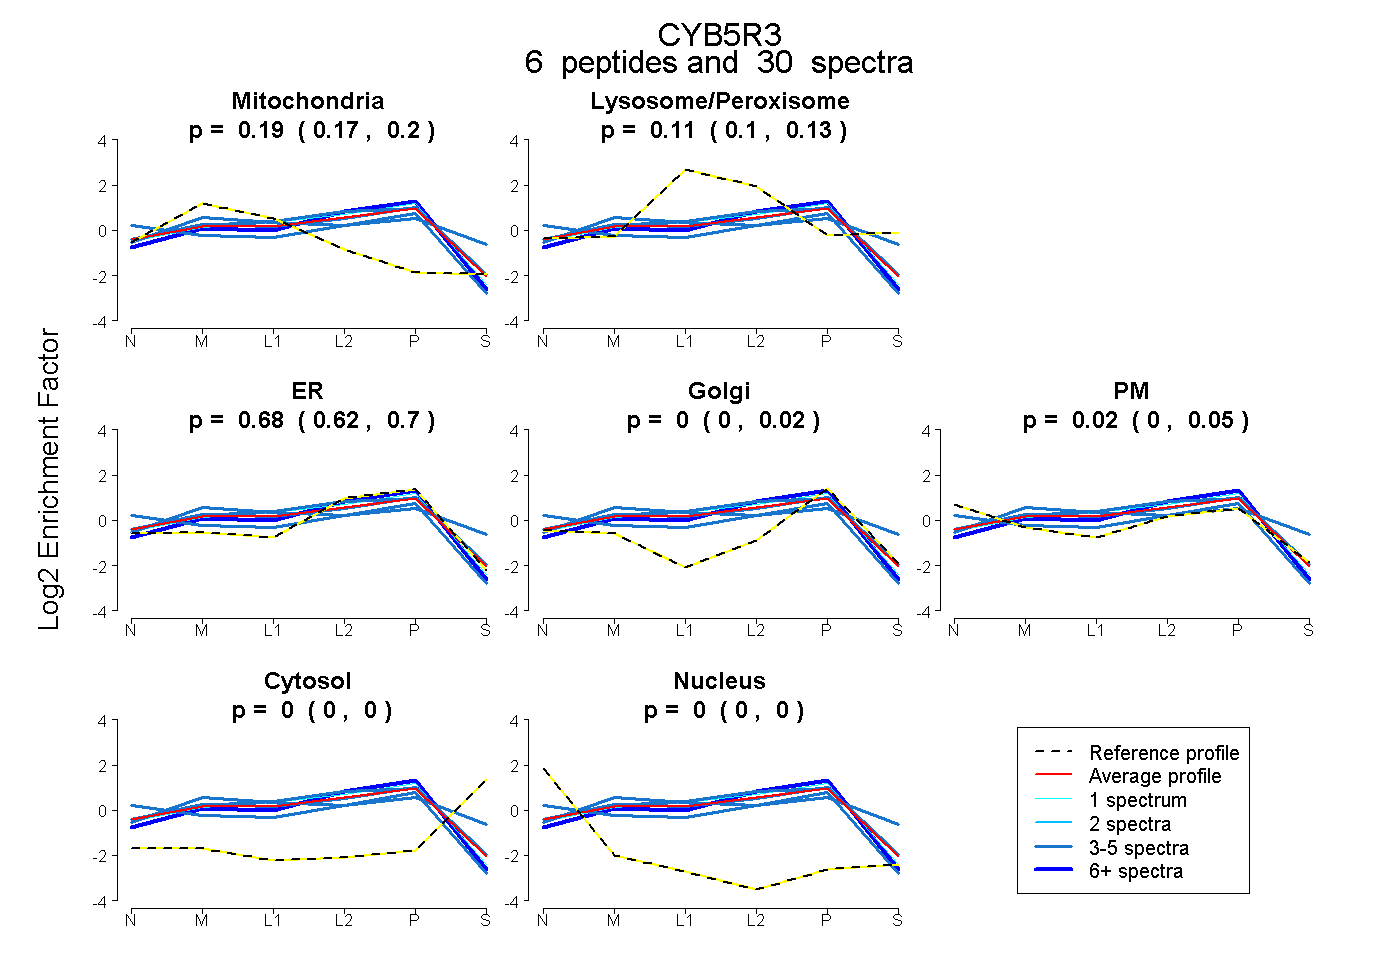 |
0.187
0.166 | 0.200 |
|
0.112
0.095 | 0.132 |
|
0.678
0.624 | 0.702 |
0.000
0.000 | 0.018 |
0.022
0.000 | 0.054 |
0.000
0.000 | 0.000 |
0.000
0.000 | 0.000 |
|
| 3 spectra, LWYTVDK |
0.146 |
|
0.199 |
|
0.656 |
0.000 |
0.000 |
0.000 |
0.000 |
|
| 4 spectra, SNPVVR |
0.185 |
|
0.127 |
|
0.667 |
0.016 |
0.005 |
0.000 |
0.000 |
|
| 13 spectra, DILLRPELEELR |
0.108 |
|
0.045 |
|
0.847 |
0.000 |
0.000 |
0.000 |
0.000 |
|
| 4 spectra, SSPAITLENPDIK |
0.000 |
|
0.266 |
|
0.000 |
0.181 |
0.452 |
0.101 |
0.000 |
|
| 1 spectrum, GFVDLVVK |
0.139 |
|
0.124 |
|
0.737 |
0.000 |
0.000 |
0.000 |
0.000 |
|
| 5 spectra, GPNGLLVYQGK |
0.355 |
|
0.000 |
|
0.645 |
0.000 |
0.000 |
0.000 |
0.000 |
|
| | | Plot |
|
Lyso |
|
|
|
|
|
|
|
Other |
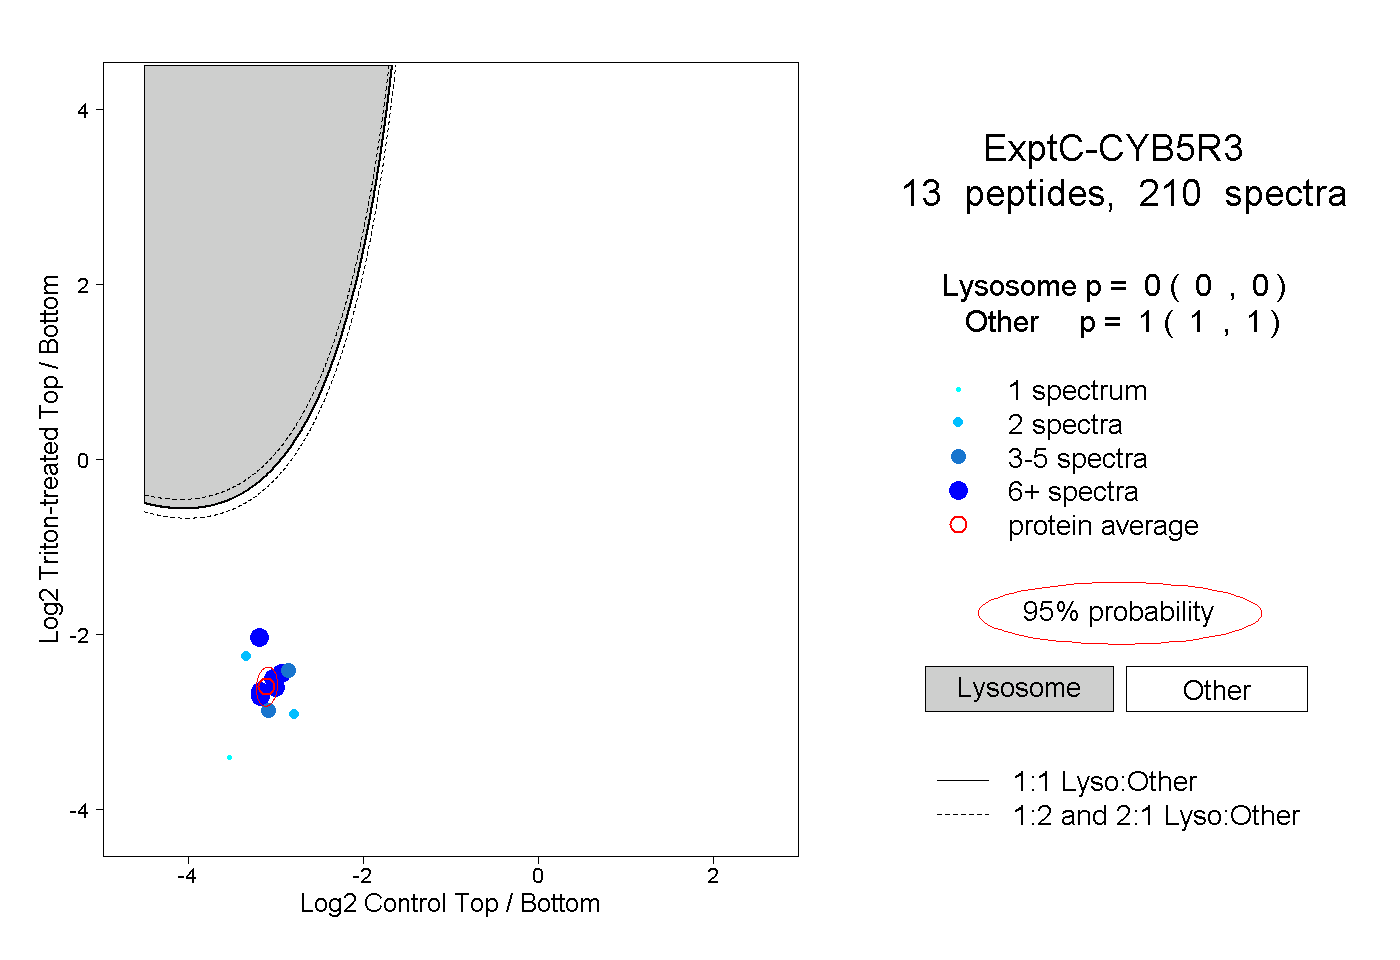
| Expt C |
13
peptides |
210
spectra |
 |
|
0.000
0.000 | 0.000 |
|
|
|
|
|
|
|
1.000
1.000 | 1.000 |
| | | Plot |
|
Lyso |
|
|
|
|
|
|
|
Other |
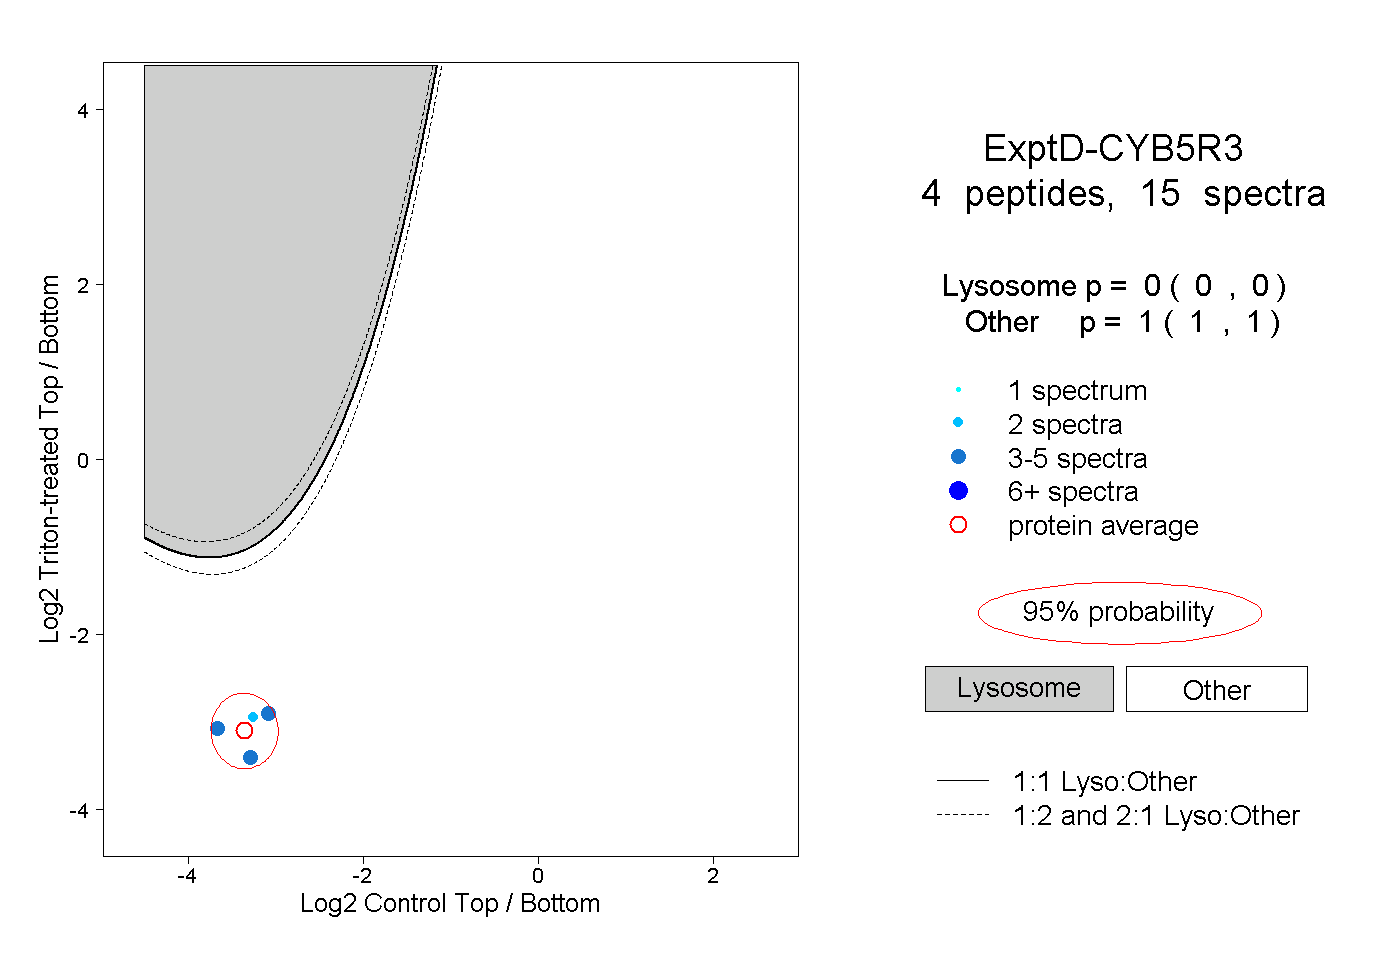
| Expt D |
4
peptides |
15
spectra |
 |
|
0.000
0.000 | 0.000 |
|
|
|
|
|
|
|
1.000
1.000 | 1.000 |