 10
10peptides
spectra
0.155 | 0.159
0.081 | 0.094
0.000 | 0.000
0.603 | 0.615
0.002 | 0.017
0.122 | 0.146
0.000 | 0.000
0.000 | 0.000
| Plot | Mito | Lyso | Perox | ER | Golgi | PM | Cytosol | Nucleus | |||||
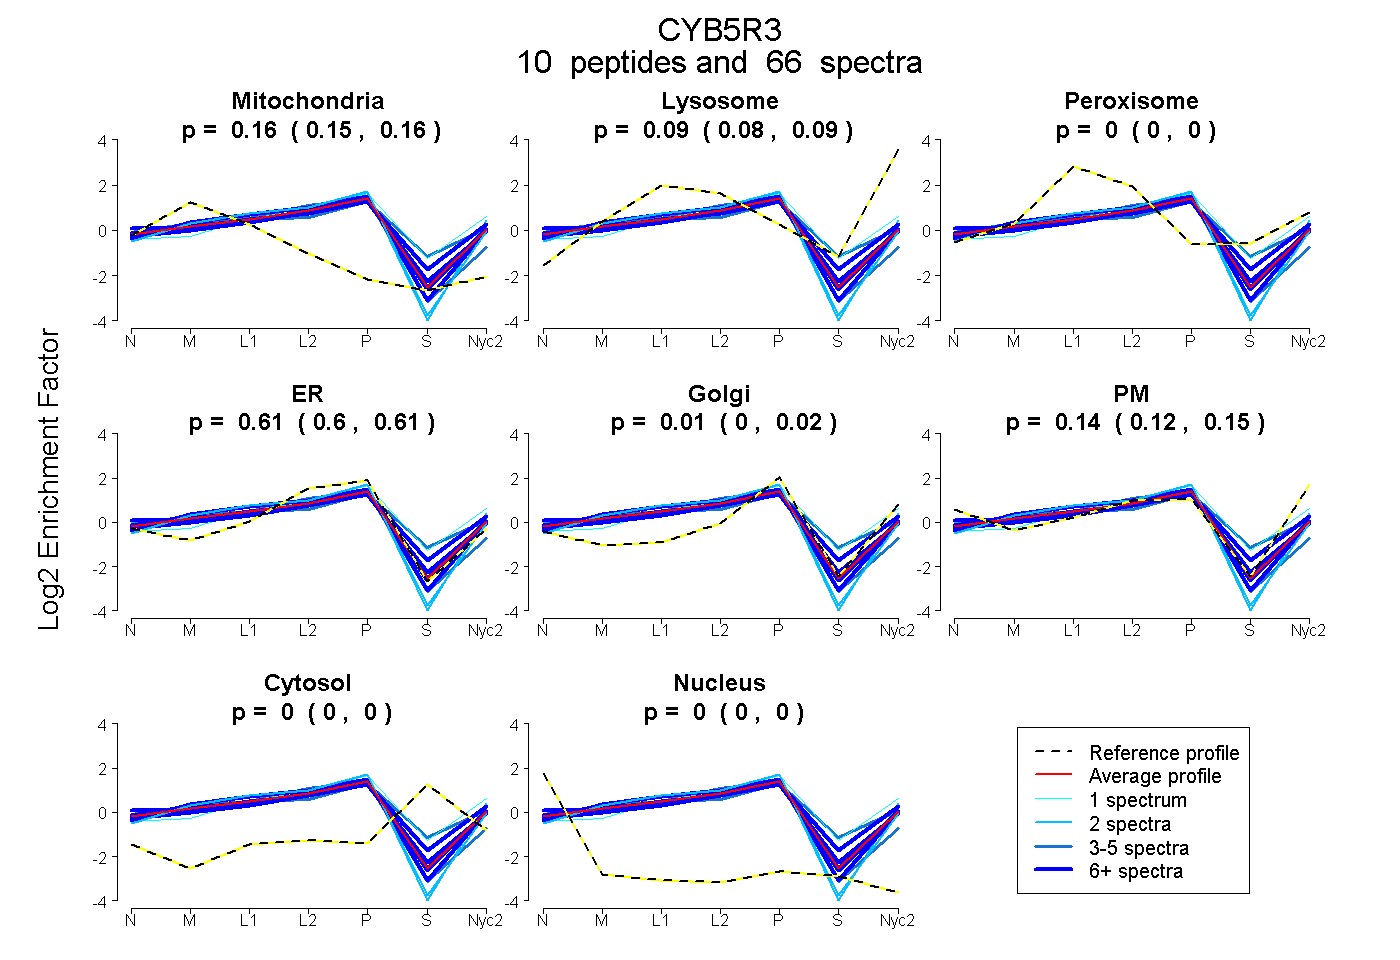
| Expt A |
10 peptides |
66 spectra |
|
0.157 0.155 | 0.159 |
0.088 0.081 | 0.094 |
0.000 0.000 | 0.000 |
0.609 0.603 | 0.615 |
0.010 0.002 | 0.017 |
0.135 0.122 | 0.146 |
0.000 0.000 | 0.000 |
0.000 0.000 | 0.000 |
| 20 spectra, SNPVVR | 0.152 | 0.000 | 0.098 | 0.465 | 0.080 | 0.205 | 0.000 | 0.000 | ||
| 17 spectra, DILLRPELEELR | 0.171 | 0.093 | 0.000 | 0.571 | 0.037 | 0.128 | 0.000 | 0.000 | ||
| 2 spectra, SVGMIAGGTGITPMLQVIR | 0.132 | 0.071 | 0.000 | 0.767 | 0.000 | 0.030 | 0.000 | 0.000 | ||
| 3 spectra, FPAGGK | 0.054 | 0.000 | 0.326 | 0.165 | 0.412 | 0.000 | 0.043 | 0.000 | ||
| 1 spectrum, IDGNLVIRPYTPVSSDDDK | 0.000 | 0.019 | 0.335 | 0.156 | 0.490 | 0.000 | 0.000 | 0.000 | ||
| 6 spectra, LWYTVDK | 0.156 | 0.070 | 0.000 | 0.576 | 0.019 | 0.180 | 0.000 | 0.000 | ||
| 6 spectra, SSPAITLENPDIK | 0.067 | 0.000 | 0.272 | 0.231 | 0.430 | 0.000 | 0.000 | 0.000 | ||
| 2 spectra, GFVDLVVK | 0.071 | 0.000 | 0.000 | 0.560 | 0.000 | 0.369 | 0.000 | 0.000 | ||
| 6 spectra, MSQYLENMNIGDTIEFR | 0.153 | 0.108 | 0.000 | 0.691 | 0.000 | 0.047 | 0.000 | 0.000 | ||
| 3 spectra, GPNGLLVYQGK | 0.210 | 0.000 | 0.000 | 0.790 | 0.000 | 0.000 | 0.000 | 0.000 |
| Plot | Mito | Lyso or Perox | ER | Golgi | PM | Cytosol | Nucleus | ||||||
| Expt B |
6 peptides |
30 spectra |
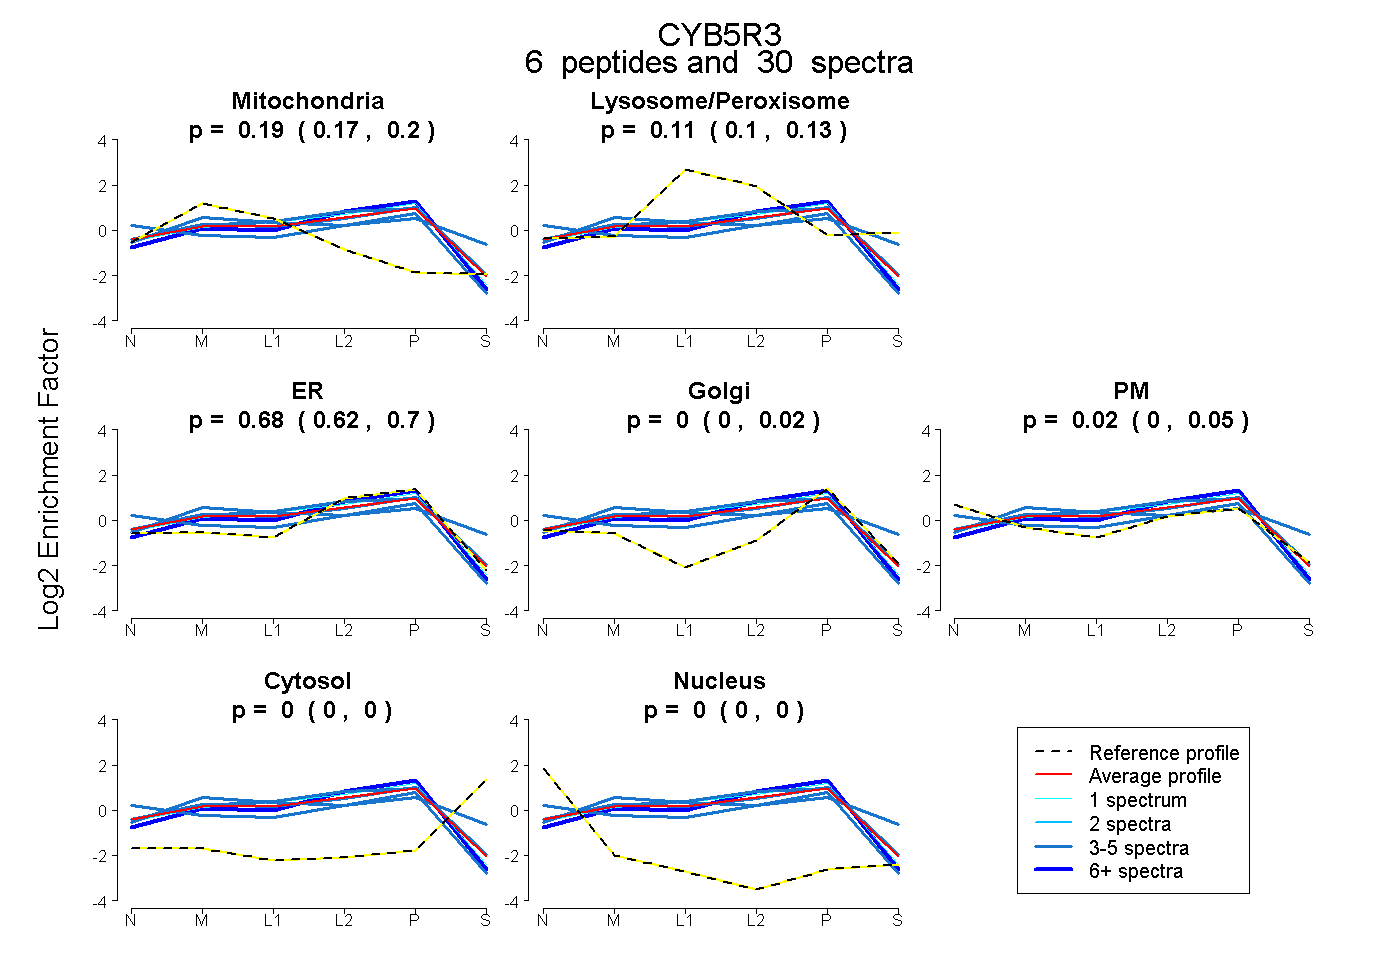 |
0.187 0.166 | 0.200 |
0.112 0.095 | 0.132 |
0.678 0.624 | 0.702 |
0.000 0.000 | 0.018 |
0.022 0.000 | 0.054 |
0.000 0.000 | 0.000 |
0.000 0.000 | 0.000 |
|||
| Plot | Lyso | Other | |||||||||||
| Expt C |
13 peptides |
210 spectra |
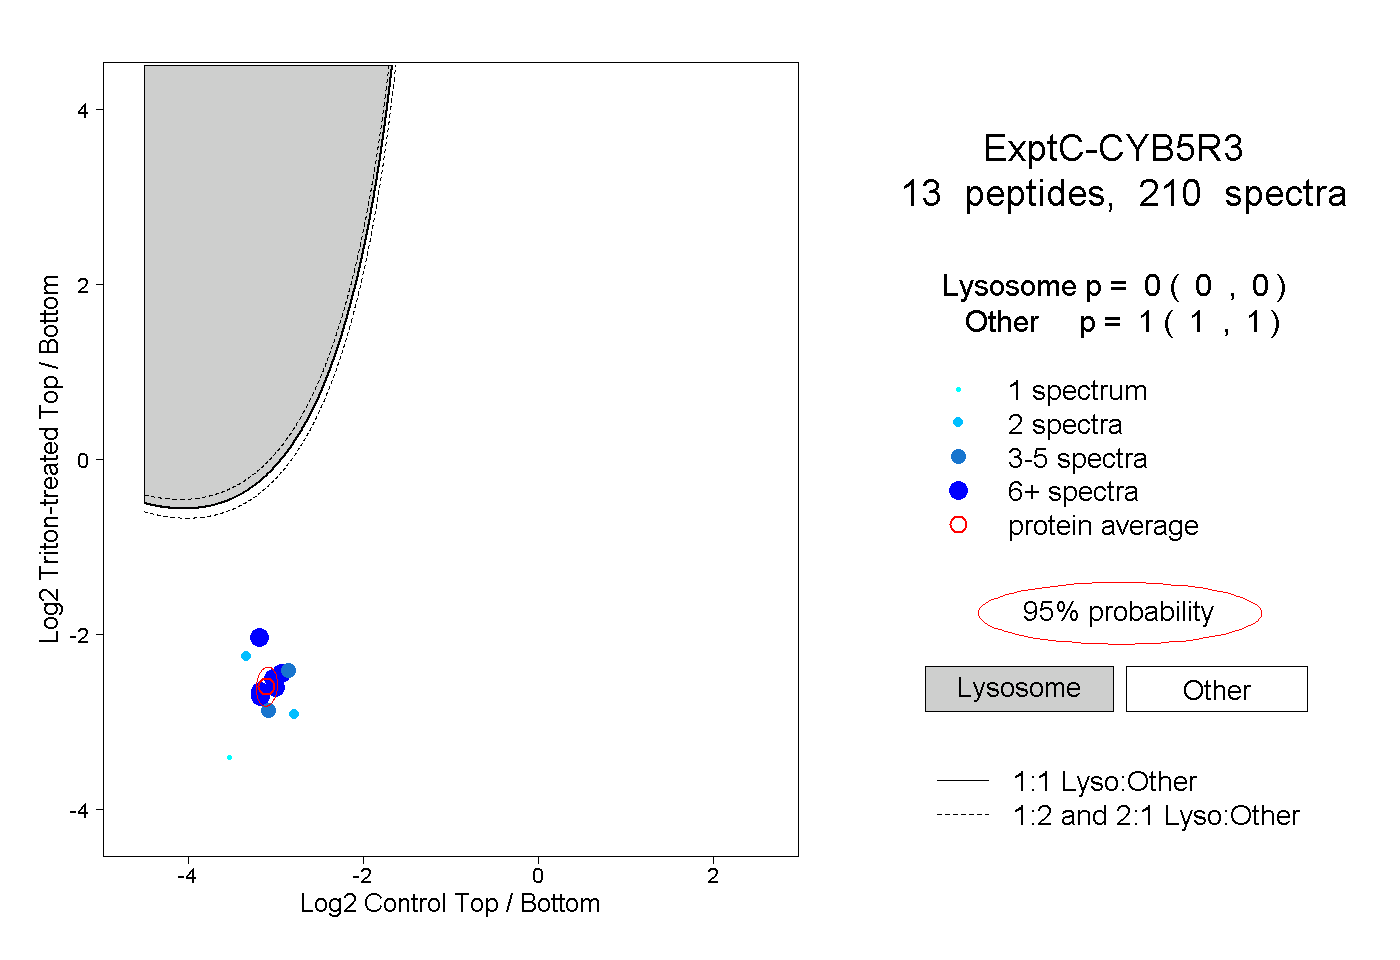 |
0.000 0.000 | 0.000 |
1.000 1.000 | 1.000 |
||||||||
| Plot | Lyso | Other | |||||||||||
| Expt D |
4 peptides |
15 spectra |
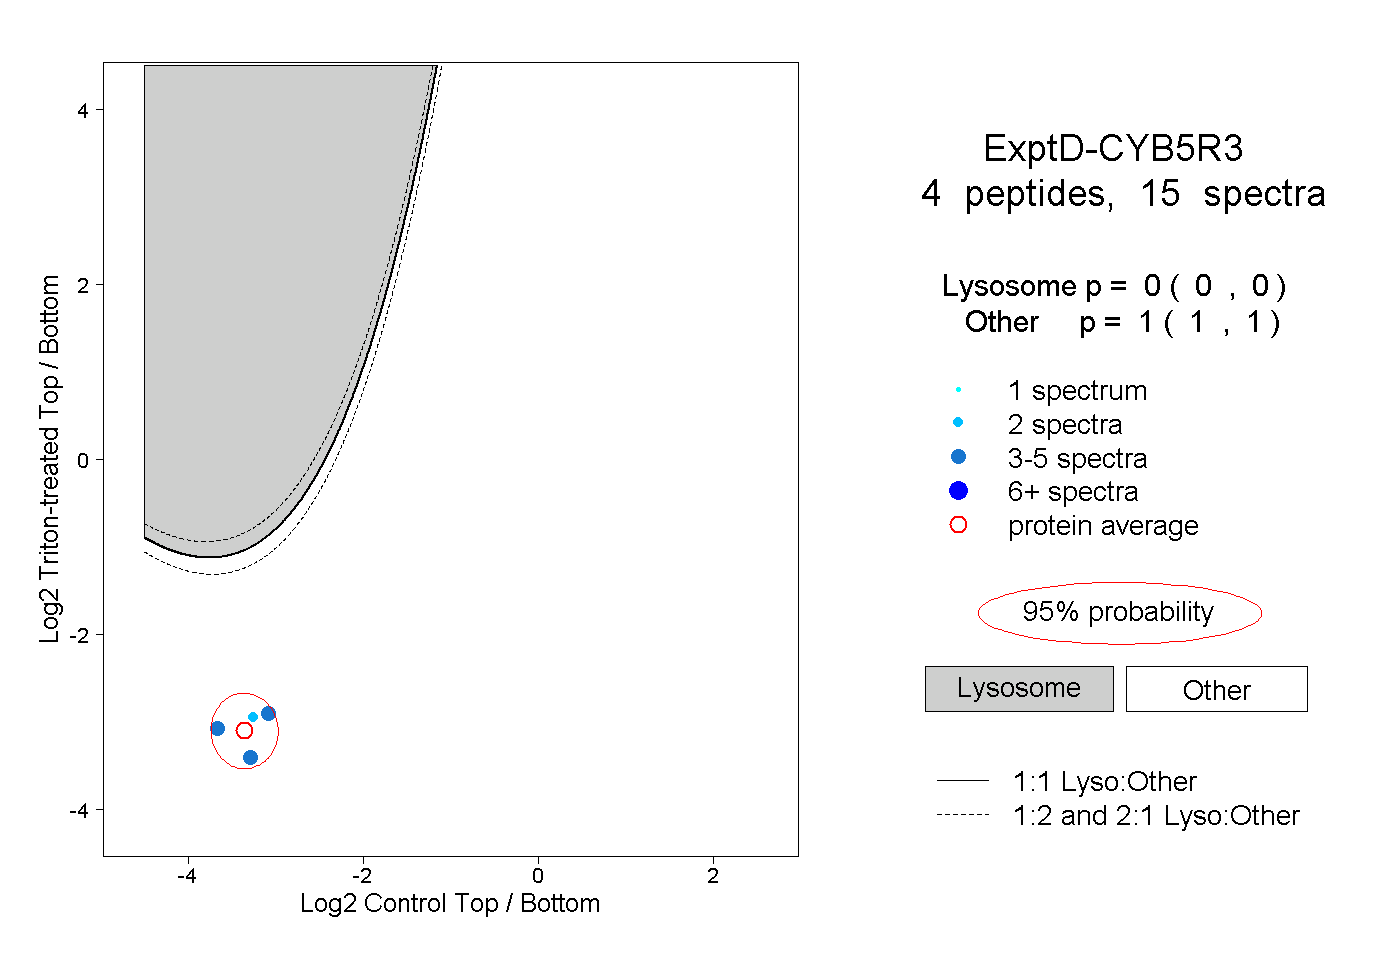 |
0.000 0.000 | 0.000 |
1.000 1.000 | 1.000 |