 29
29peptides
spectra
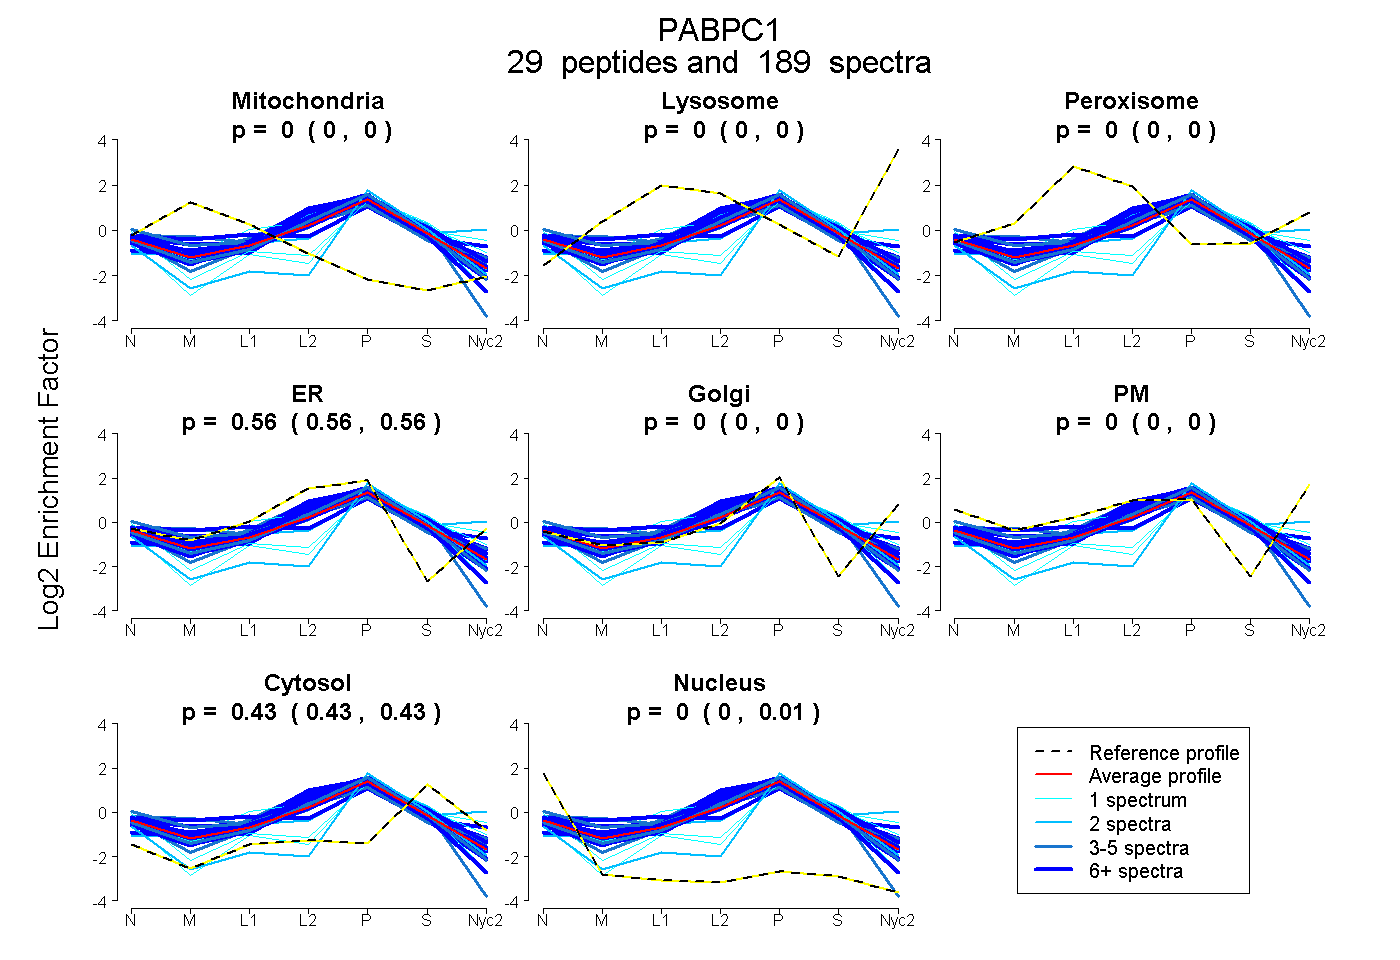
0.000 | 0.000
0.000 | 0.000
0.000 | 0.000
0.561 | 0.564
0.000 | 0.000
0.000 | 0.000
0.432 | 0.434
0.003 | 0.006
20peptides
spectra
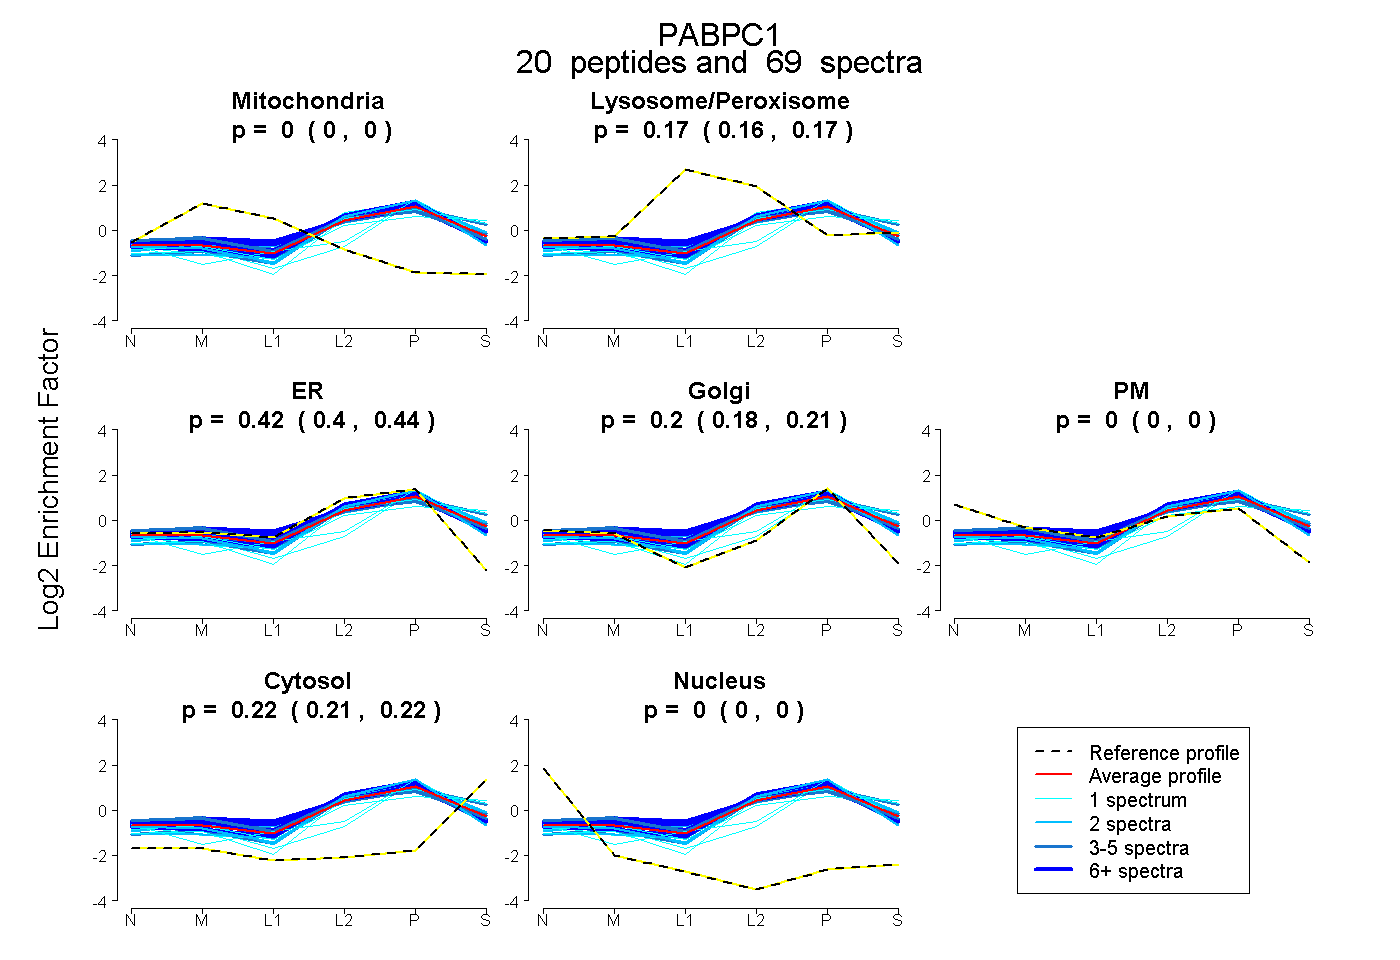
0.000 | 0.000
0.160 | 0.172
0.404 | 0.436
0.181 | 0.209
0.000 | 0.000
0.212 | 0.219
0.000 | 0.000
25peptides
spectra
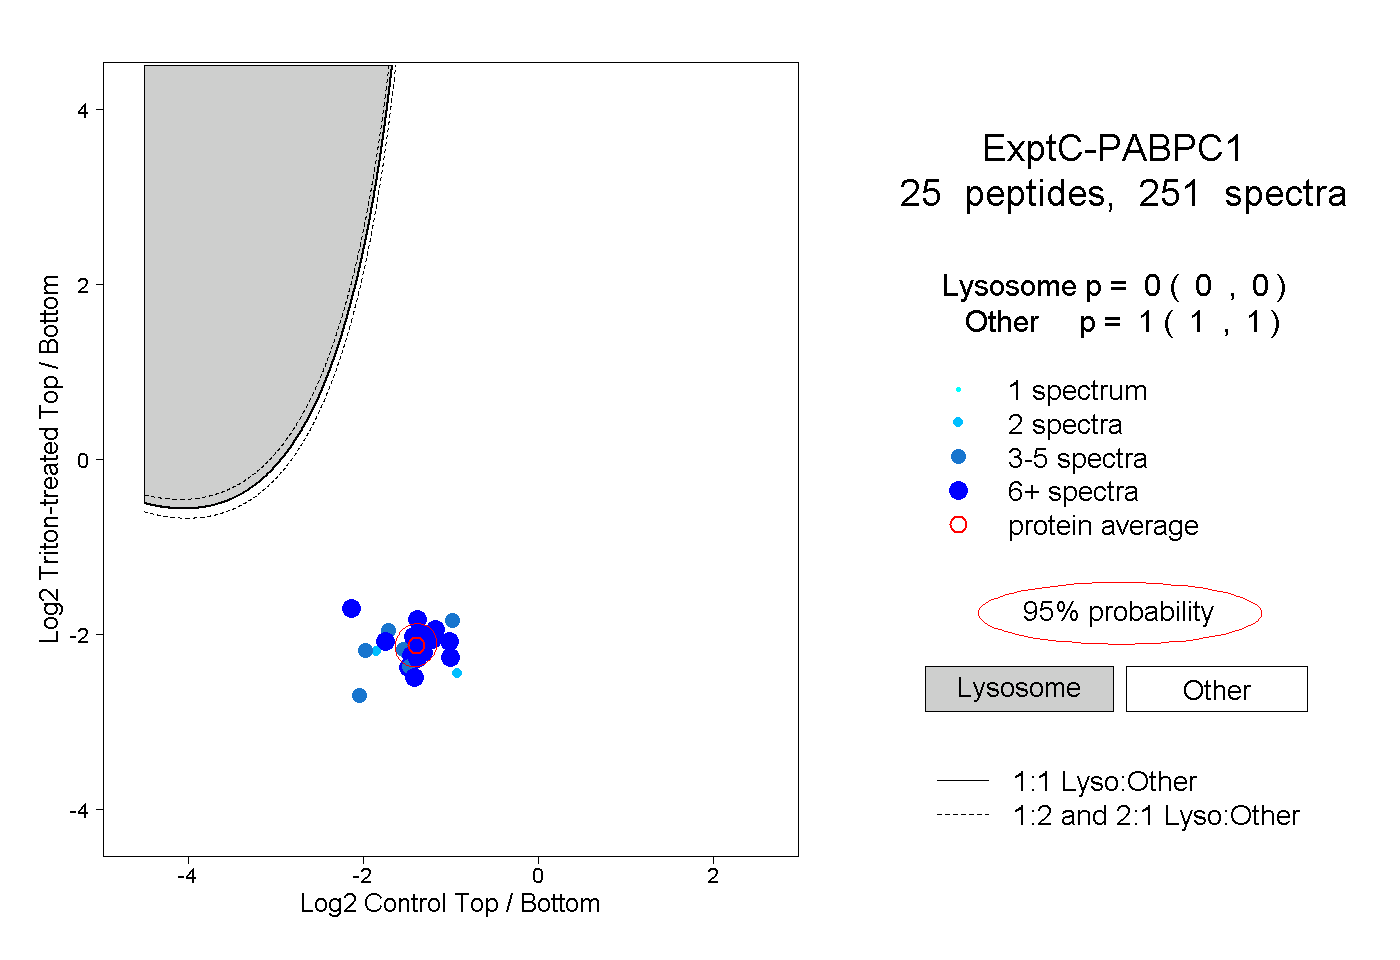
0.000 | 0.000
1.000 | 1.000
9peptides
spectra
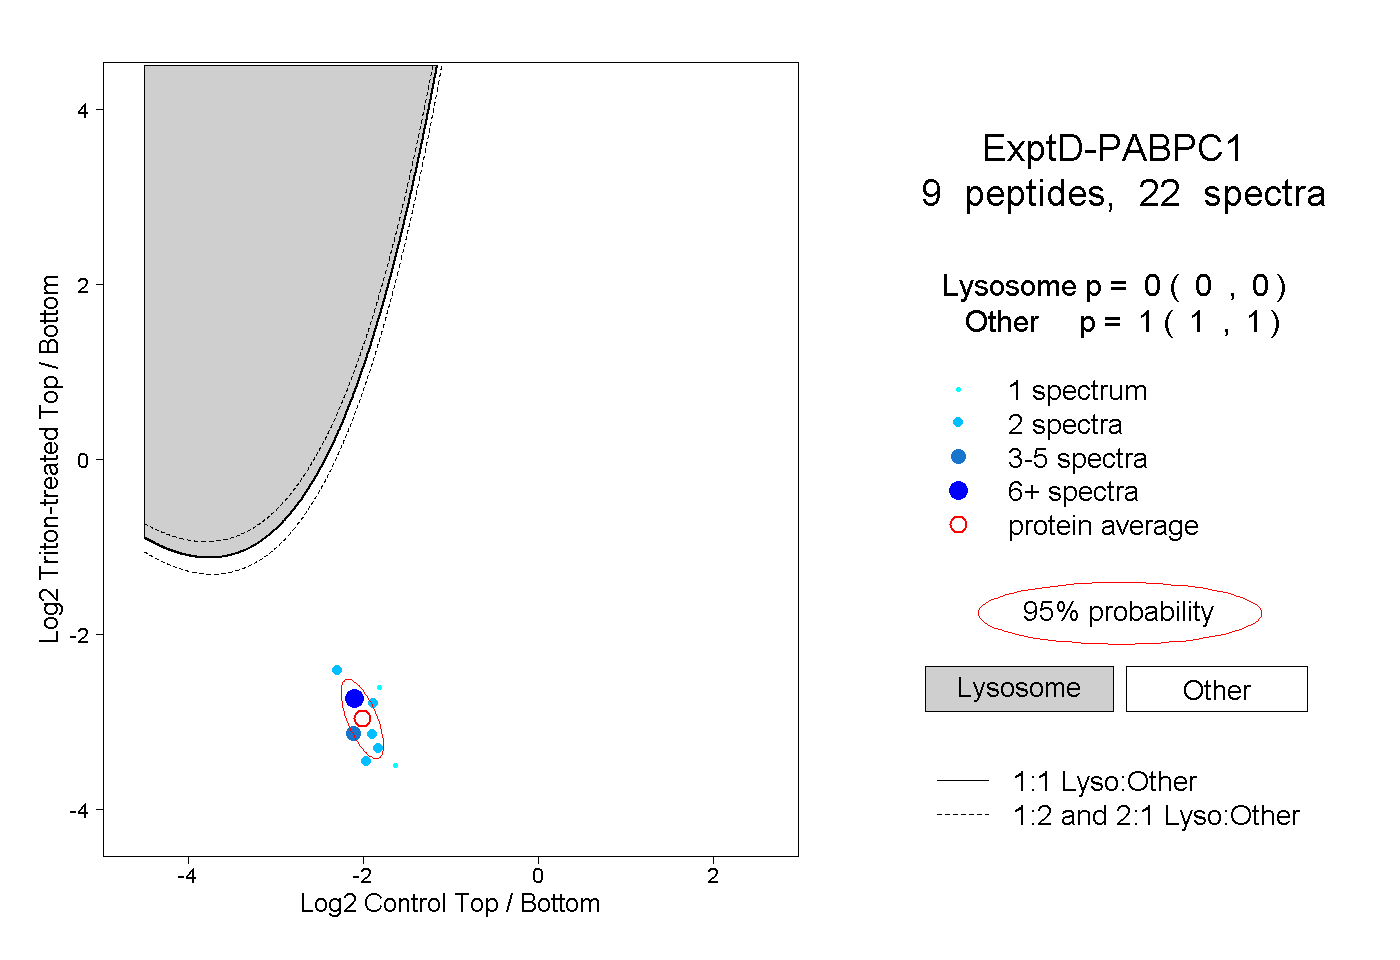
0.000 | 0.000
1.000 | 1.000