 47
47peptides
spectra

0.000 | 0.000
0.256 | 0.260
0.000 | 0.000
0.232 | 0.239
0.075 | 0.082
0.014 | 0.023
0.407 | 0.410
0.000 | 0.000
34peptides
spectra
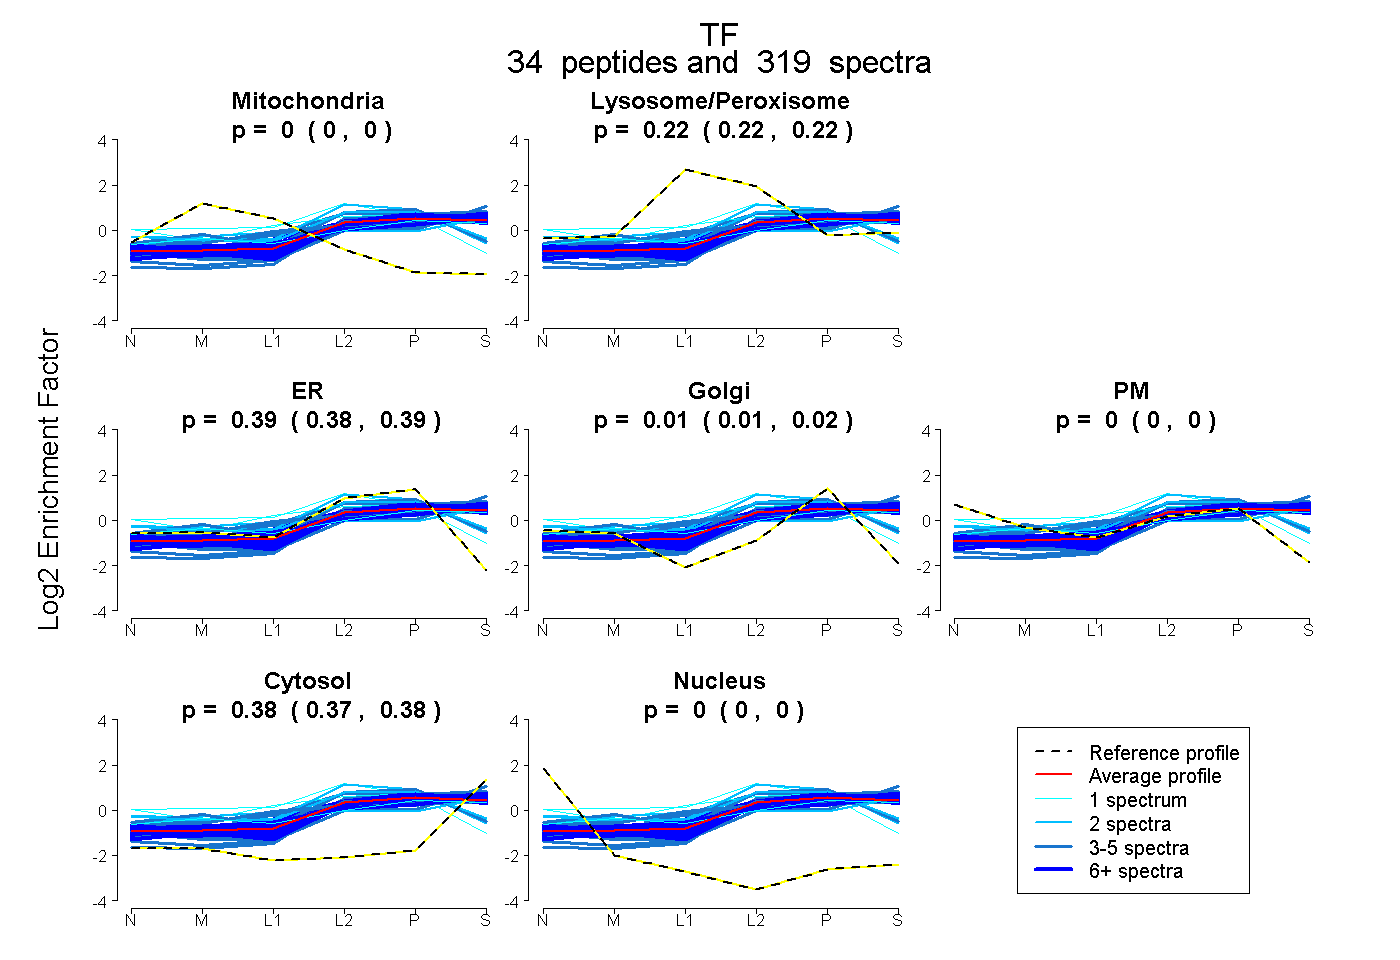
0.000 | 0.000
0.220 | 0.225
0.383 | 0.394
0.007 | 0.016
0.000 | 0.000
0.375 | 0.378
0.000 | 0.000
42peptides
spectra
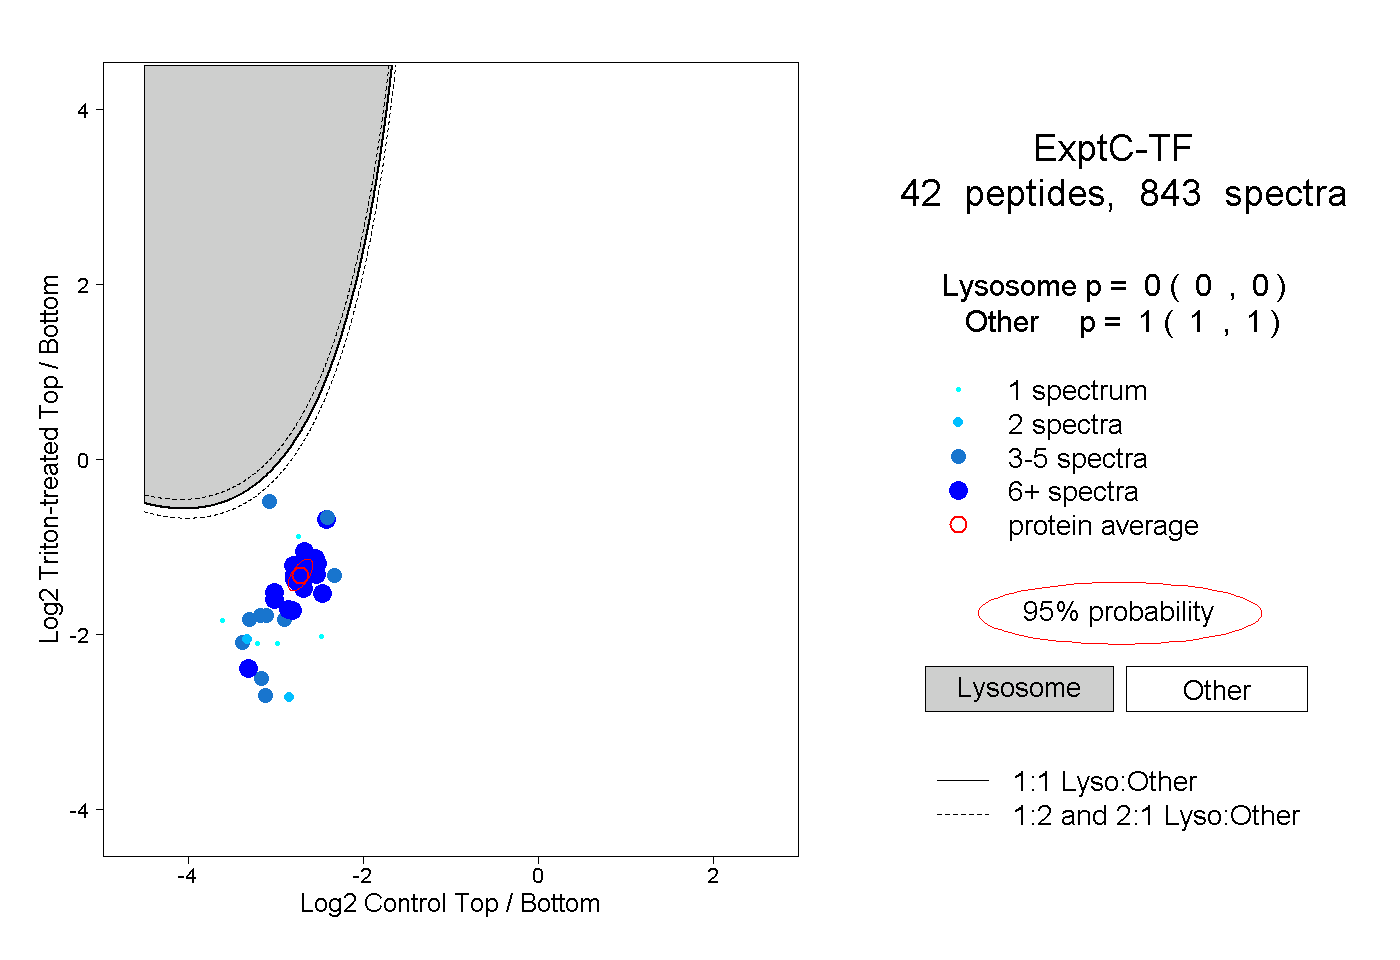
0.000 | 0.000
1.000 | 1.000
25peptides
spectra

0.000 | 0.000
1.000 | 1.000