 47
47peptides
spectra

0.000 | 0.000
0.256 | 0.260
0.000 | 0.000
0.232 | 0.239
0.075 | 0.082
0.014 | 0.023
0.407 | 0.410
0.000 | 0.000
| Plot | Mito | Lyso | Perox | ER | Golgi | PM | Cytosol | Nucleus | |||||
| Expt A |
47 peptides |
480 spectra |
|
0.000 0.000 | 0.000 |
0.258 0.256 | 0.260 |
0.000 0.000 | 0.000 |
0.236 0.232 | 0.239 |
0.079 0.075 | 0.082 |
0.019 0.014 | 0.023 |
0.409 0.407 | 0.410 |
0.000 0.000 | 0.000 |
| 2 spectra, ELDTLR | 0.000 | 0.000 | 0.060 | 0.361 | 0.177 | 0.046 | 0.356 | 0.000 | ||
| 1 spectrum, QELQQR | 0.004 | 0.000 | 0.079 | 0.457 | 0.085 | 0.316 | 0.059 | 0.000 | ||
| 14 spectra, LLEACTFHK | 0.000 | 0.169 | 0.000 | 0.256 | 0.000 | 0.000 | 0.575 | 0.000 | ||
| 3 spectra, LLTGQYR | 0.000 | 0.000 | 0.102 | 0.756 | 0.000 | 0.079 | 0.063 | 0.000 | ||
| 1 spectrum, DTQTSITDSSAIYK | 0.000 | 0.000 | 0.103 | 0.874 | 0.000 | 0.000 | 0.023 | 0.000 | ||
| 6 spectra, DCTGNFCLFR | 0.000 | 0.107 | 0.000 | 0.275 | 0.000 | 0.000 | 0.618 | 0.000 | ||
| 4 spectra, GDAGSADVQDLEK | 0.000 | 0.000 | 0.234 | 0.402 | 0.073 | 0.068 | 0.222 | 0.000 | ||
| 19 spectra, SCHTGVDR | 0.000 | 0.371 | 0.000 | 0.110 | 0.000 | 0.058 | 0.461 | 0.000 | ||
| 31 spectra, LYLGHSYVTAIR | 0.000 | 0.310 | 0.000 | 0.000 | 0.181 | 0.000 | 0.509 | 0.000 | ||
| 13 spectra, GDVAFVK | 0.000 | 0.337 | 0.000 | 0.000 | 0.145 | 0.000 | 0.518 | 0.000 | ||
| 3 spectra, FDEFFSQGCAPGYK | 0.000 | 0.294 | 0.136 | 0.000 | 0.116 | 0.000 | 0.455 | 0.000 | ||
| 15 spectra, VAQEHFGK | 0.000 | 0.256 | 0.000 | 0.000 | 0.201 | 0.064 | 0.479 | 0.000 | ||
| 22 spectra, KPVDQYEDCYLAR | 0.000 | 0.284 | 0.000 | 0.103 | 0.106 | 0.000 | 0.507 | 0.000 | ||
| 2 spectra, HQTVLENTNGK | 0.000 | 0.091 | 0.084 | 0.000 | 0.120 | 0.115 | 0.591 | 0.000 | ||
| 9 spectra, SCHTGLGR | 0.000 | 0.059 | 0.243 | 0.000 | 0.239 | 0.158 | 0.300 | 0.000 | ||
| 12 spectra, DQYELLCLDNTR | 0.000 | 0.346 | 0.000 | 0.060 | 0.115 | 0.063 | 0.415 | 0.000 | ||
| 38 spectra, TVLPADGPR | 0.000 | 0.334 | 0.000 | 0.000 | 0.138 | 0.000 | 0.528 | 0.000 | ||
| 10 spectra, ASDSSINWNNLK | 0.000 | 0.321 | 0.000 | 0.000 | 0.152 | 0.000 | 0.527 | 0.000 | ||
| 2 spectra, NTPAFLVACNK | 0.000 | 0.148 | 0.054 | 0.465 | 0.000 | 0.034 | 0.299 | 0.000 | ||
| 6 spectra, VEFLECSAK | 0.000 | 0.136 | 0.041 | 0.268 | 0.000 | 0.419 | 0.136 | 0.000 | ||
| 19 spectra, TSYQDCIK | 0.000 | 0.177 | 0.083 | 0.169 | 0.081 | 0.000 | 0.490 | 0.000 | ||
| 2 spectra, AVVFVVDSATFQR | 0.000 | 0.000 | 0.040 | 0.935 | 0.000 | 0.005 | 0.000 | 0.020 | ||
| 1 spectrum, EGVCPEGSIDSAPVK | 0.000 | 0.000 | 0.000 | 0.000 | 0.000 | 0.362 | 0.594 | 0.045 | ||
| 7 spectra, QDIAMAK | 0.013 | 0.000 | 0.339 | 0.045 | 0.418 | 0.137 | 0.049 | 0.000 | ||
| 29 spectra, DSAFGLLR | 0.000 | 0.363 | 0.000 | 0.000 | 0.146 | 0.000 | 0.491 | 0.000 | ||
| 25 spectra, DGGGDVAFVK | 0.000 | 0.364 | 0.000 | 0.000 | 0.174 | 0.000 | 0.462 | 0.000 | ||
| 3 spectra, EDLIWEILK | 0.000 | 0.337 | 0.000 | 0.000 | 0.083 | 0.000 | 0.580 | 0.000 | ||
| 21 spectra, LACVK | 0.000 | 0.276 | 0.000 | 0.082 | 0.100 | 0.000 | 0.542 | 0.000 | ||
| 4 spectra, DFQLFGSPLGK | 0.000 | 0.372 | 0.000 | 0.000 | 0.112 | 0.000 | 0.516 | 0.000 | ||
| 2 spectra, TLLFVR | 0.000 | 0.000 | 0.003 | 0.965 | 0.000 | 0.000 | 0.000 | 0.032 | ||
| 62 spectra, IPSHAVVAR | 0.000 | 0.360 | 0.000 | 0.000 | 0.175 | 0.000 | 0.466 | 0.000 | ||
| 1 spectrum, CAPNNR | 0.000 | 0.087 | 0.052 | 0.025 | 0.000 | 0.362 | 0.474 | 0.000 | ||
| 2 spectra, LQFLDR | 0.000 | 0.137 | 0.060 | 0.429 | 0.000 | 0.112 | 0.262 | 0.000 | ||
| 1 spectrum, GNSLTLIDLPGHESLR | 0.000 | 0.000 | 0.134 | 0.479 | 0.000 | 0.340 | 0.046 | 0.000 | ||
| 9 spectra, NTAAWAK | 0.000 | 0.368 | 0.000 | 0.003 | 0.128 | 0.033 | 0.467 | 0.000 | ||
| 21 spectra, GYYAVAVVK | 0.000 | 0.339 | 0.000 | 0.021 | 0.179 | 0.006 | 0.456 | 0.000 | ||
| 10 spectra, GTDFQLNQLQGK | 0.000 | 0.368 | 0.000 | 0.000 | 0.124 | 0.020 | 0.487 | 0.000 | ||
| 2 spectra, EGYNGYTGAFQCLVEK | 0.098 | 0.000 | 0.245 | 0.192 | 0.063 | 0.000 | 0.402 | 0.000 | ||
| 3 spectra, QEDFQLLCPDGTK | 0.000 | 0.347 | 0.000 | 0.000 | 0.000 | 0.181 | 0.472 | 0.000 | ||
| 4 spectra, HTTIFEVLPQK | 0.000 | 0.166 | 0.190 | 0.000 | 0.126 | 0.116 | 0.402 | 0.000 | ||
| 1 spectrum, VGDGAGGAFQPYLDSLR | 0.000 | 0.192 | 0.000 | 0.201 | 0.000 | 0.316 | 0.292 | 0.000 | ||
| 2 spectra, KPVTEFATCHLAQAPNHVVVSR | 0.000 | 0.339 | 0.000 | 0.017 | 0.082 | 0.096 | 0.466 | 0.000 | ||
| 5 spectra, WCAVSEHENTK | 0.000 | 0.272 | 0.000 | 0.120 | 0.039 | 0.000 | 0.570 | 0.000 | ||
| 14 spectra, WCALSHQER | 0.000 | 0.348 | 0.000 | 0.175 | 0.029 | 0.000 | 0.448 | 0.000 | ||
| 7 spectra, TAGWNIPMGLLFSR | 0.000 | 0.460 | 0.000 | 0.000 | 0.135 | 0.000 | 0.405 | 0.000 | ||
| 9 spectra, VSTVLTAQK | 0.000 | 0.388 | 0.000 | 0.026 | 0.124 | 0.000 | 0.462 | 0.000 | ||
| 1 spectrum, LIQQQLEK | 0.000 | 0.000 | 0.011 | 0.855 | 0.000 | 0.000 | 0.134 | 0.000 |
| Plot | Mito | Lyso or Perox | ER | Golgi | PM | Cytosol | Nucleus | ||||||
| Expt B |
34 peptides |
319 spectra |
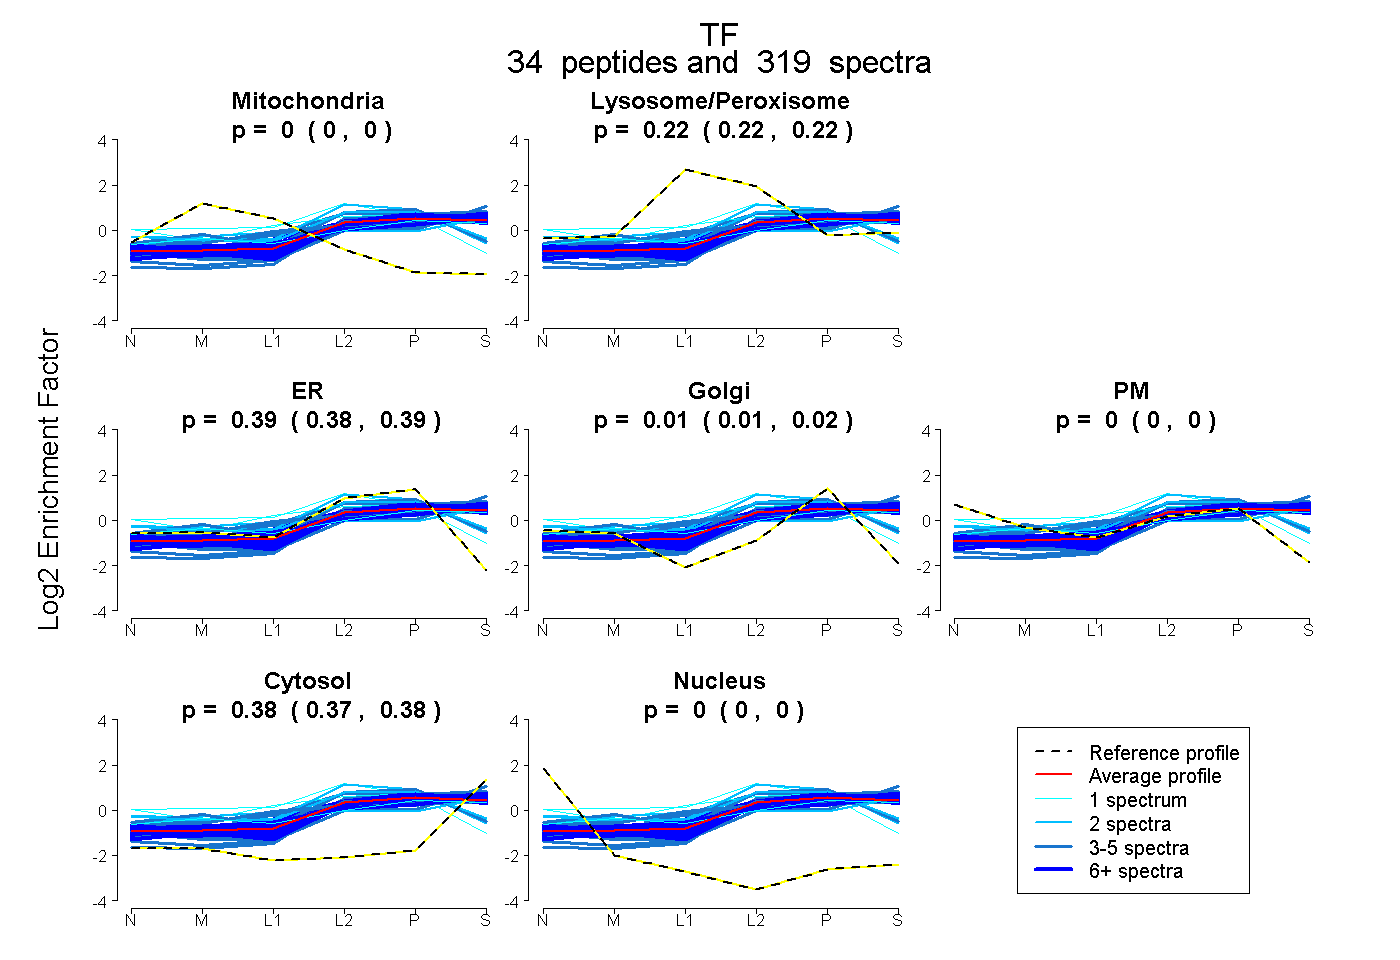 |
0.000 0.000 | 0.000 |
0.223 0.220 | 0.225 |
0.389 0.383 | 0.394 |
0.012 0.007 | 0.016 |
0.000 0.000 | 0.000 |
0.377 0.375 | 0.378 |
0.000 0.000 | 0.000 |
|||
| Plot | Lyso | Other | |||||||||||
| Expt C |
42 peptides |
843 spectra |
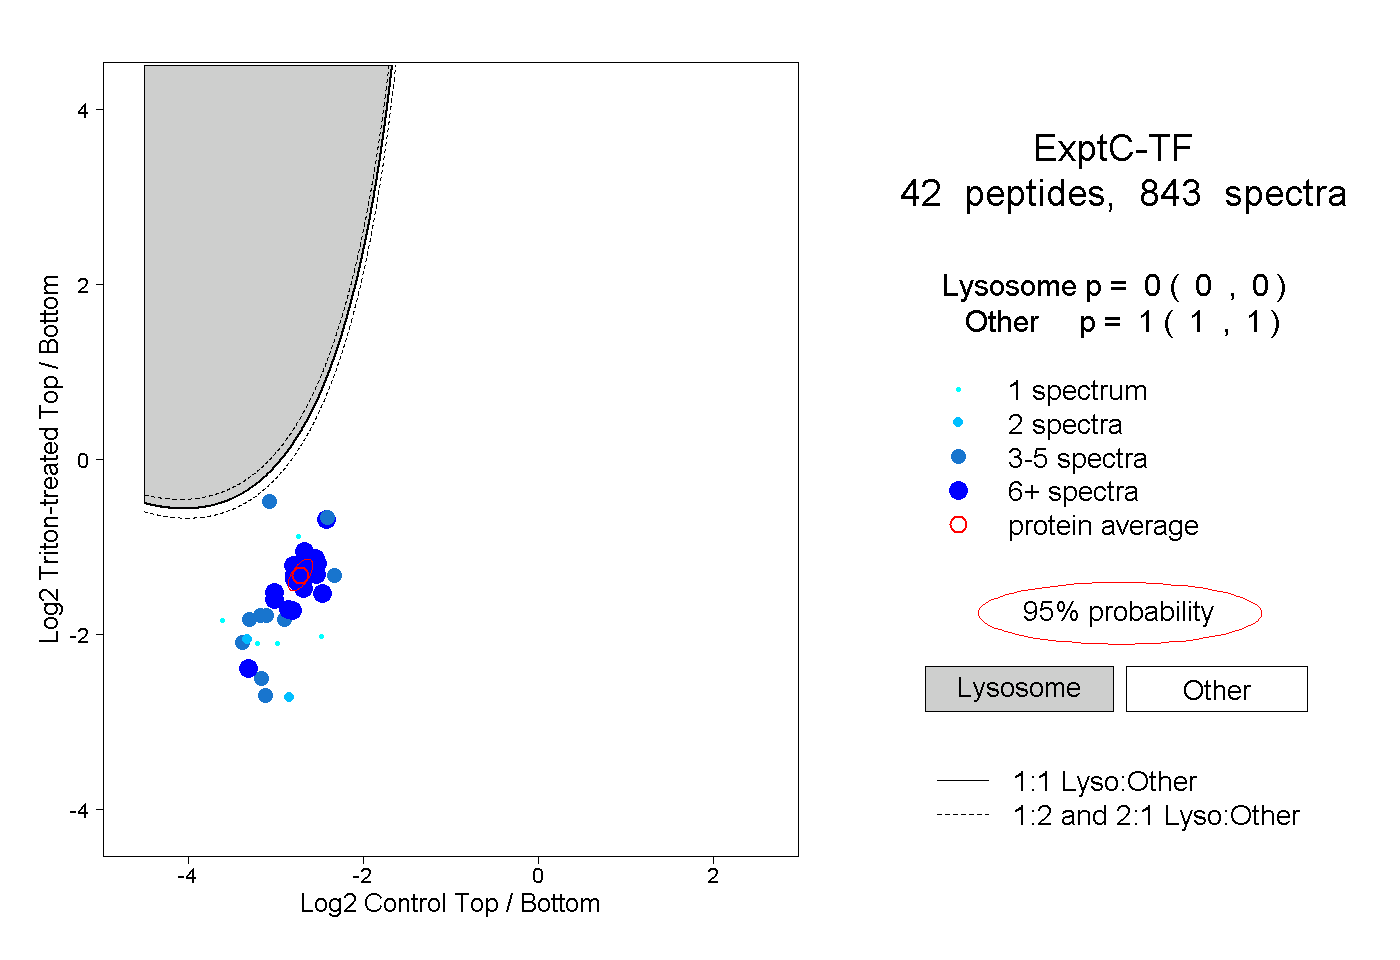 |
0.000 0.000 | 0.000 |
1.000 1.000 | 1.000 |
||||||||
| Plot | Lyso | Other | |||||||||||
| Expt D |
25 peptides |
107 spectra |
 |
0.000 0.000 | 0.000 |
1.000 1.000 | 1.000 |