 11
11peptides
spectra
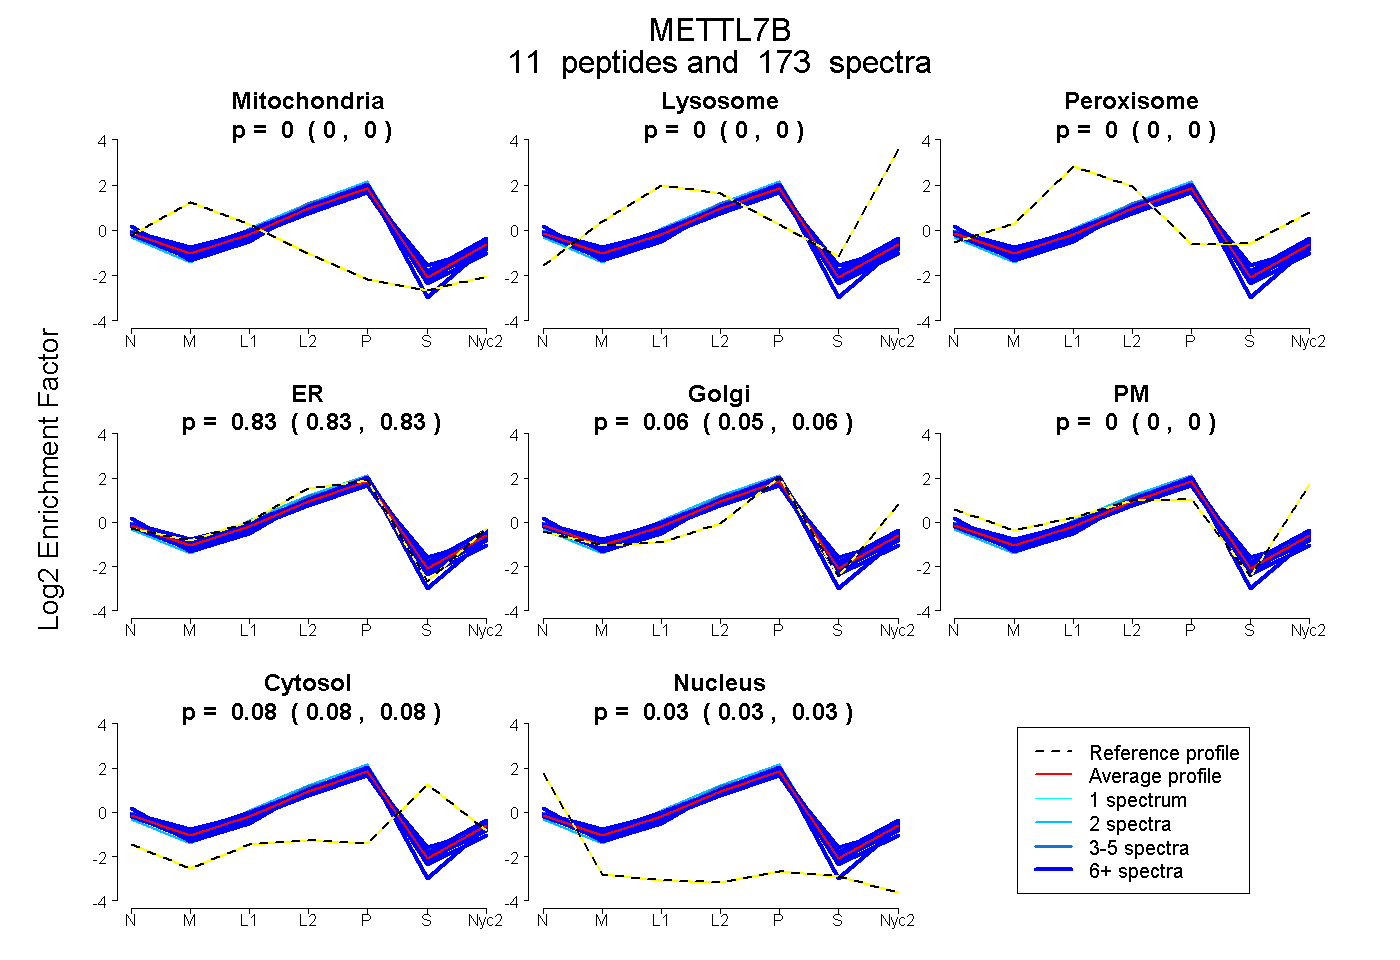
0.000 | 0.000
0.000 | 0.000
0.000 | 0.000
0.828 | 0.834
0.051 | 0.059
0.000 | 0.000
0.079 | 0.084
0.030 | 0.033
9peptides
spectra
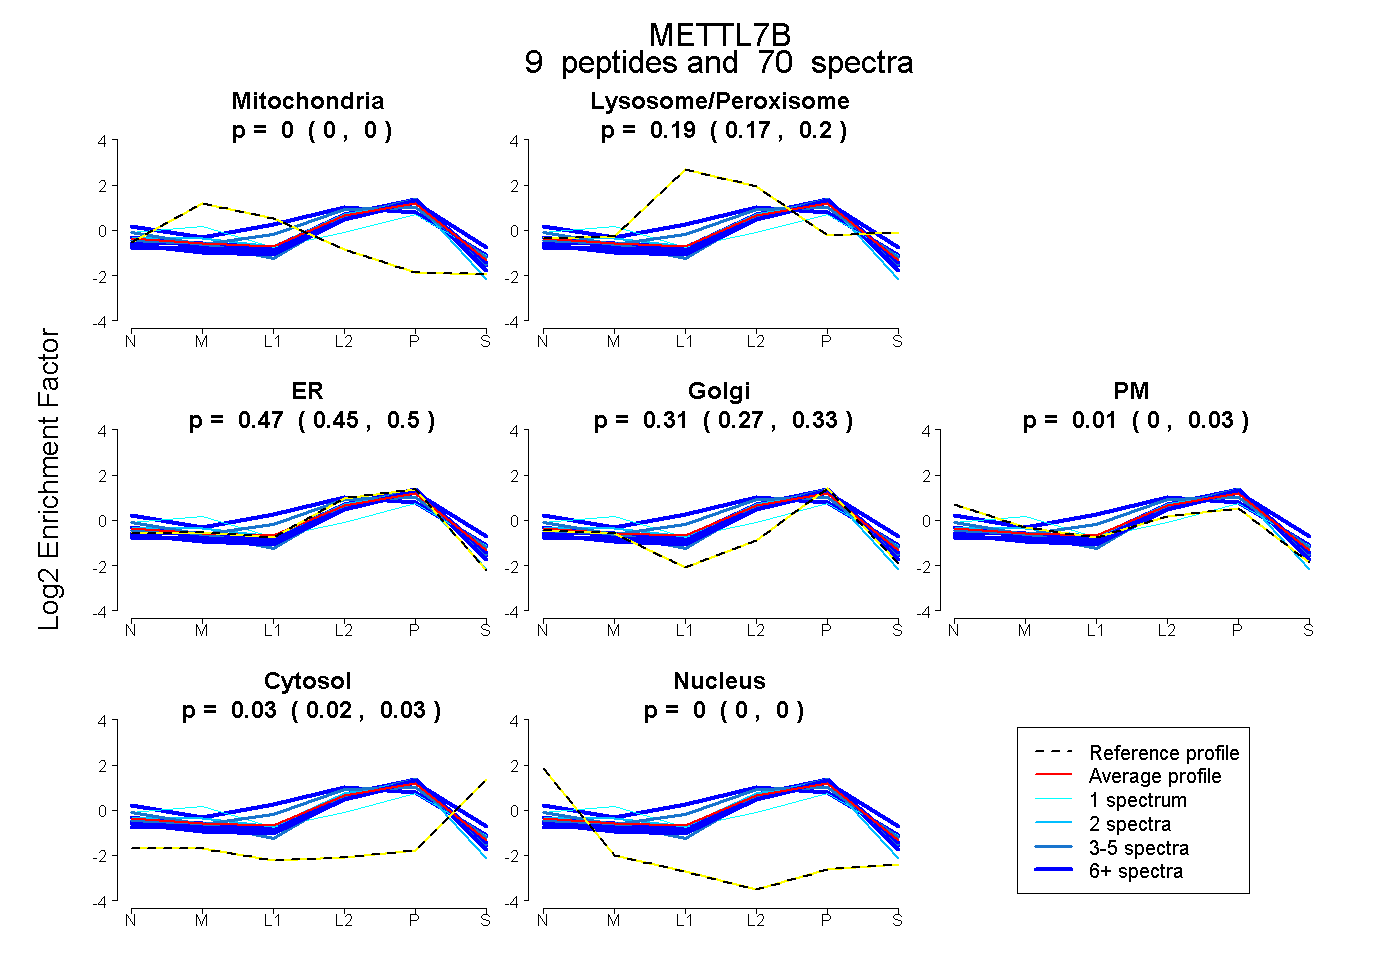
0.000 | 0.000
0.172 | 0.200
0.446 | 0.495
0.275 | 0.327
0.000 | 0.026
0.017 | 0.032
0.000 | 0.000
10peptides
spectra
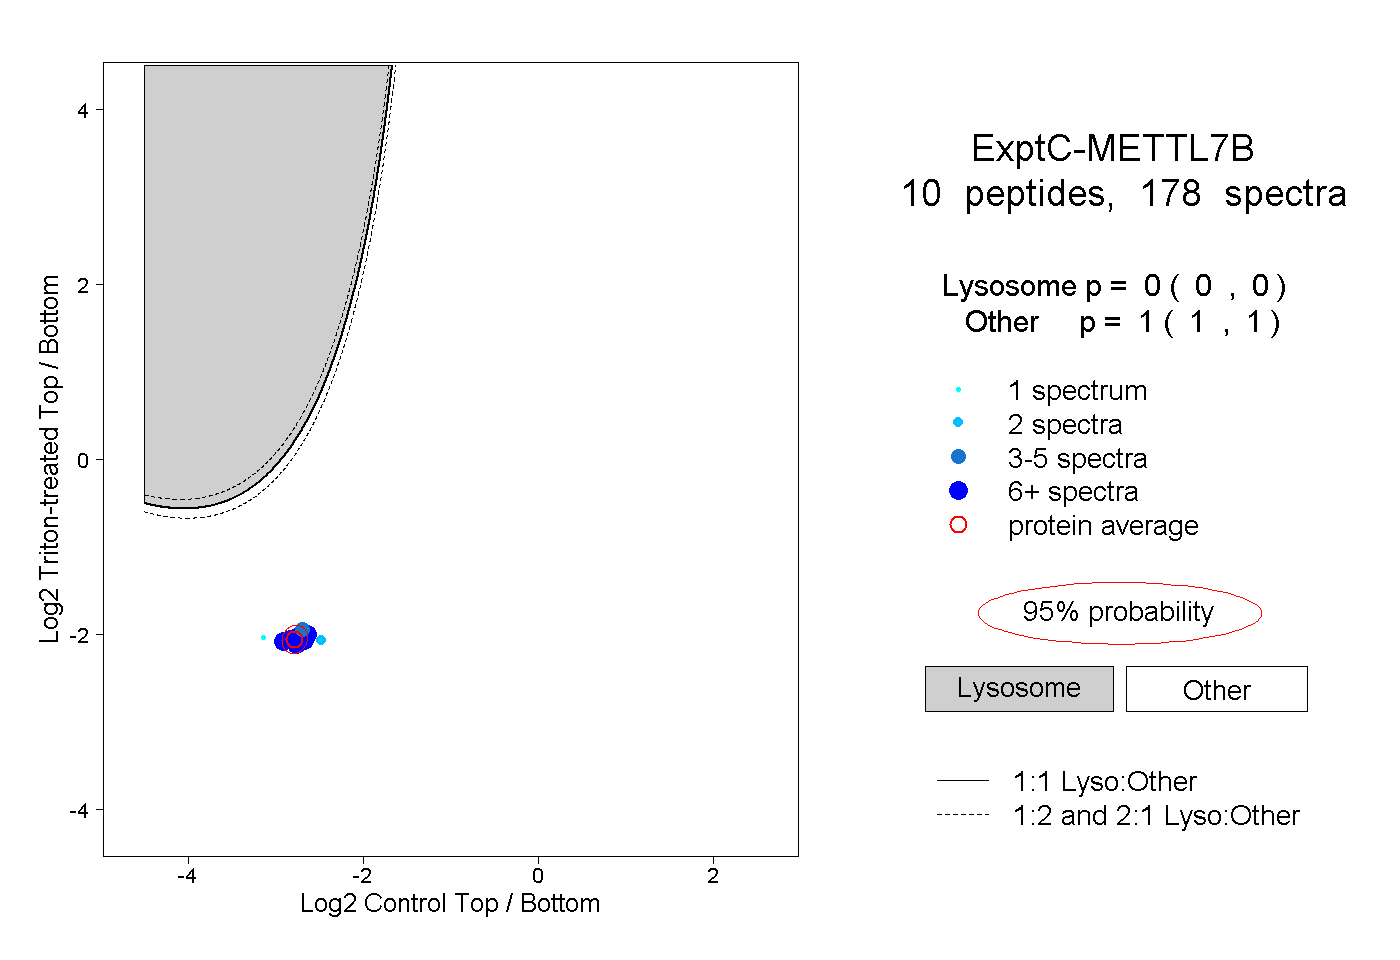
0.000 | 0.000
1.000 | 1.000
5peptides
spectra
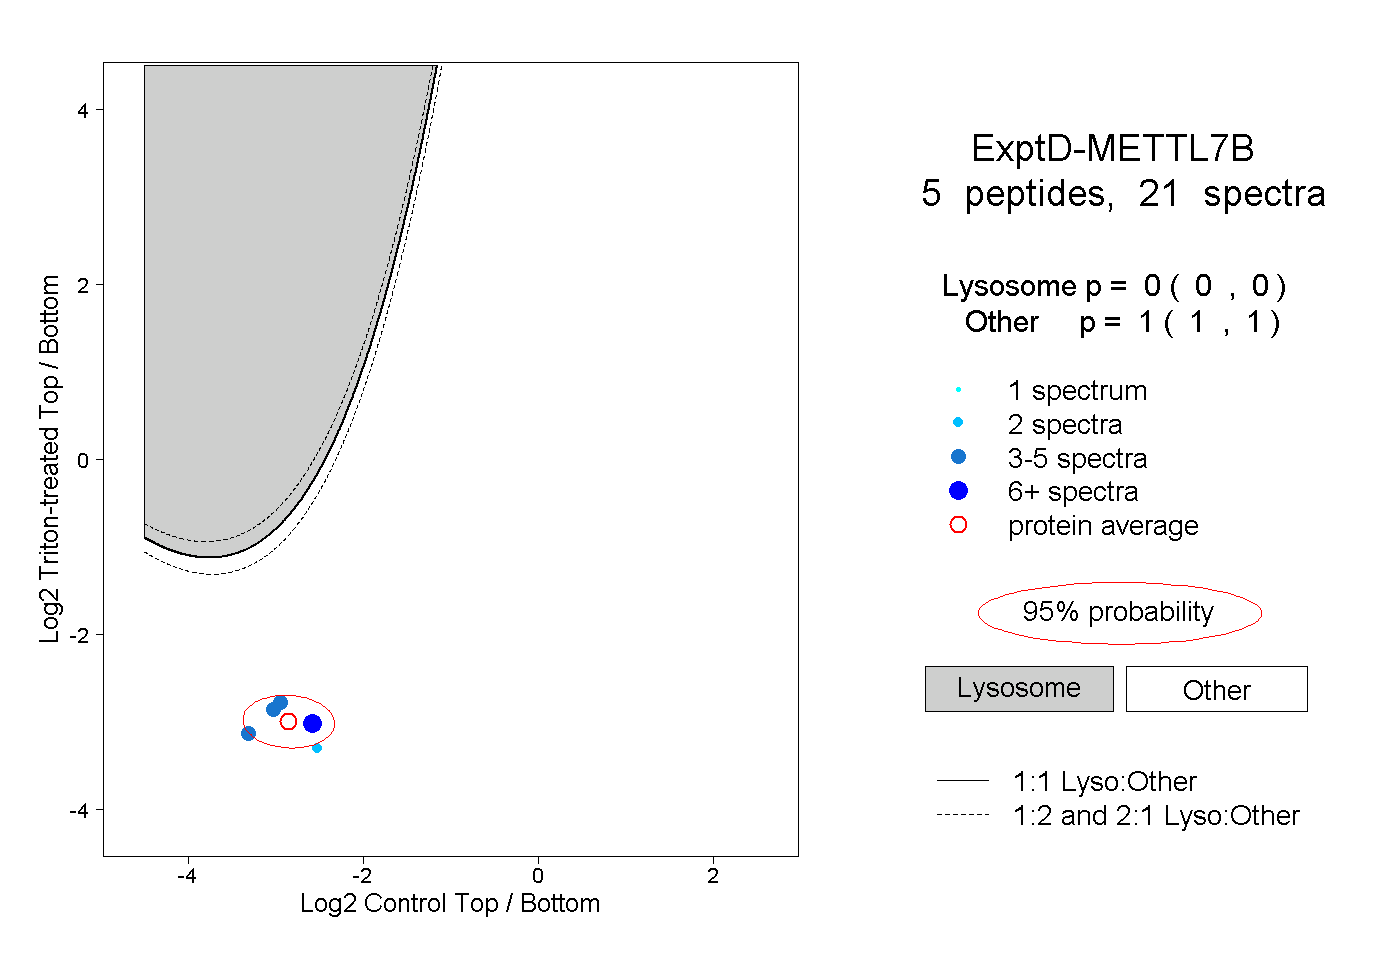
0.000 | 0.000
1.000 | 1.000