 11
11peptides
spectra
0.000 | 0.000
0.000 | 0.000
0.000 | 0.000
0.828 | 0.834
0.051 | 0.059
0.000 | 0.000
0.079 | 0.084
0.030 | 0.033
| Plot | Mito | Lyso | Perox | ER | Golgi | PM | Cytosol | Nucleus | |||||
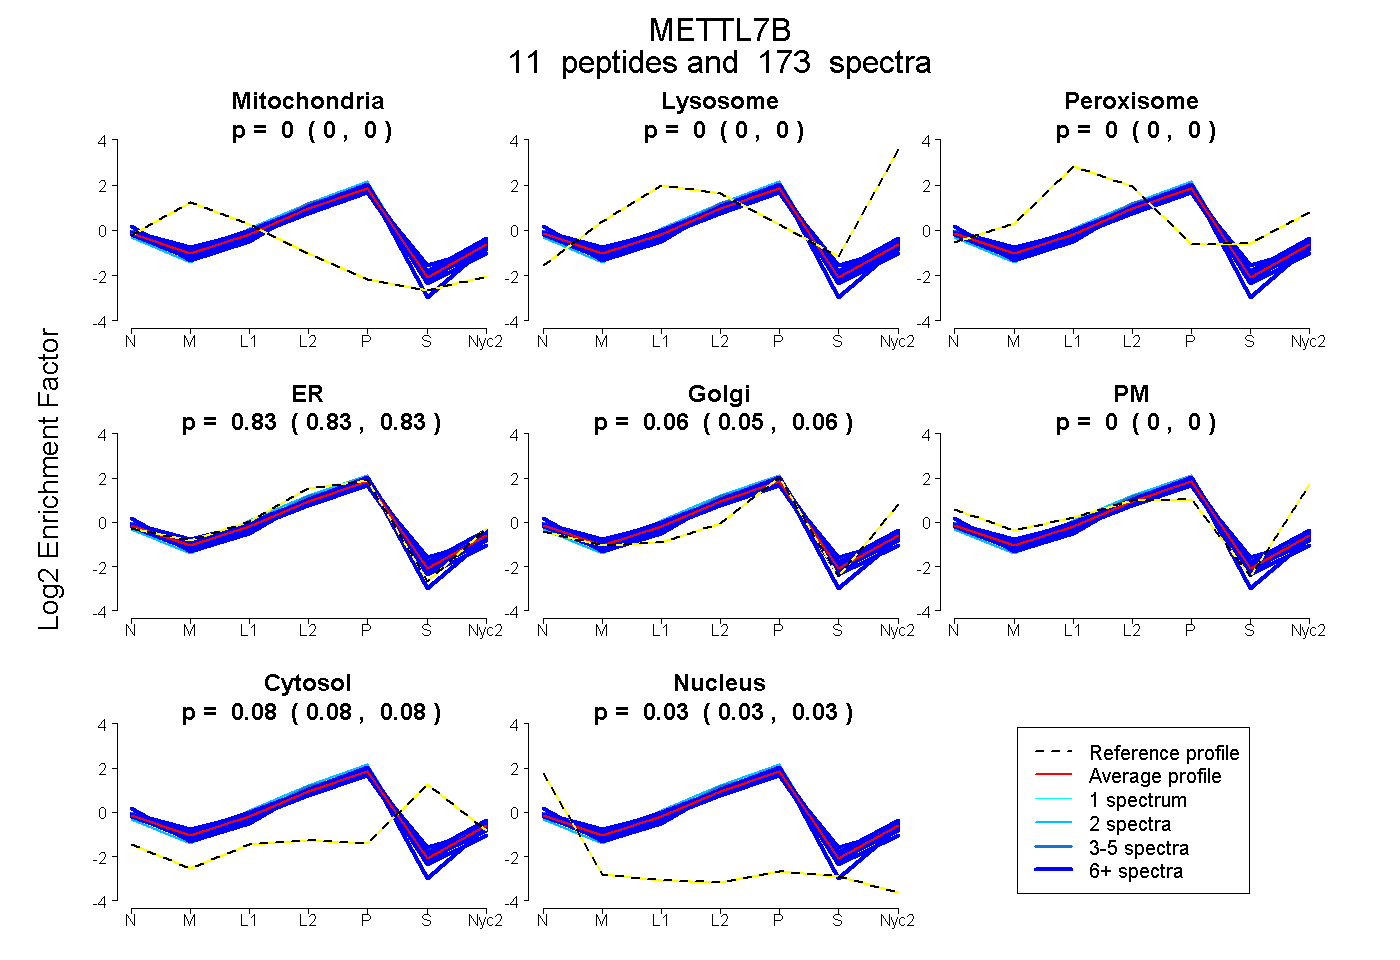
| Expt A |
11 peptides |
173 spectra |
|
0.000 0.000 | 0.000 |
0.000 0.000 | 0.000 |
0.000 0.000 | 0.000 |
0.831 0.828 | 0.834 |
0.055 0.051 | 0.059 |
0.000 0.000 | 0.000 |
0.082 0.079 | 0.084 |
0.032 0.030 | 0.033 |
| 16 spectra, SMAENR | 0.000 | 0.000 | 0.000 | 0.871 | 0.047 | 0.000 | 0.053 | 0.029 | ||
| 2 spectra, AQFSEVQLEWQPPPFK | 0.000 | 0.000 | 0.000 | 0.874 | 0.061 | 0.000 | 0.065 | 0.000 | ||
| 10 spectra, VTCVDPNPNFEK | 0.006 | 0.000 | 0.000 | 0.827 | 0.024 | 0.000 | 0.072 | 0.071 | ||
| 17 spectra, VLEPTWK | 0.000 | 0.000 | 0.000 | 0.868 | 0.000 | 0.000 | 0.036 | 0.095 | ||
| 18 spectra, ELFSQIK | 0.000 | 0.000 | 0.000 | 0.797 | 0.086 | 0.000 | 0.098 | 0.019 | ||
| 23 spectra, VLQEVQR | 0.000 | 0.000 | 0.009 | 0.798 | 0.069 | 0.000 | 0.124 | 0.000 | ||
| 10 spectra, FIVAYGENMK | 0.000 | 0.000 | 0.000 | 0.738 | 0.145 | 0.000 | 0.117 | 0.000 | ||
| 4 spectra, HLQYER | 0.000 | 0.000 | 0.000 | 0.861 | 0.012 | 0.000 | 0.127 | 0.000 | ||
| 23 spectra, HIGDGCHLTR | 0.022 | 0.000 | 0.000 | 0.816 | 0.000 | 0.000 | 0.159 | 0.003 | ||
| 6 spectra, TYFPYLMATLTAR | 0.000 | 0.000 | 0.000 | 0.854 | 0.049 | 0.000 | 0.000 | 0.097 | ||
| 44 spectra, WLPVGPHIMGK | 0.000 | 0.000 | 0.000 | 0.808 | 0.123 | 0.000 | 0.040 | 0.029 |
| Plot | Mito | Lyso or Perox | ER | Golgi | PM | Cytosol | Nucleus | ||||||
| Expt B |
9 peptides |
70 spectra |
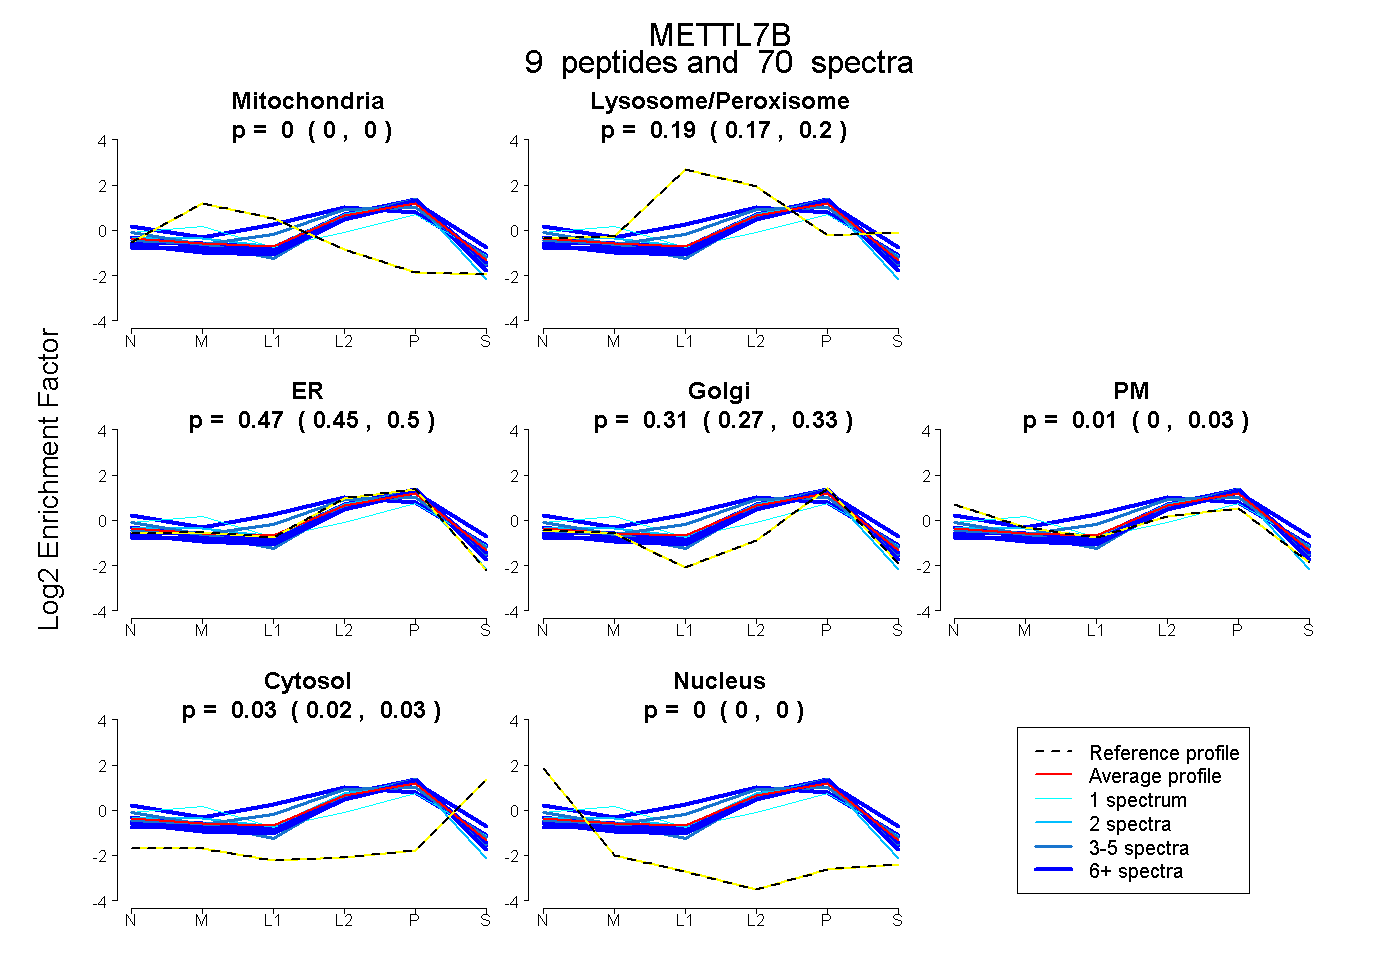 |
0.000 0.000 | 0.000 |
0.188 0.172 | 0.200 |
0.472 0.446 | 0.495 |
0.306 0.275 | 0.327 |
0.009 0.000 | 0.026 |
0.025 0.017 | 0.032 |
0.000 0.000 | 0.000 |
|||
| Plot | Lyso | Other | |||||||||||
| Expt C |
10 peptides |
178 spectra |
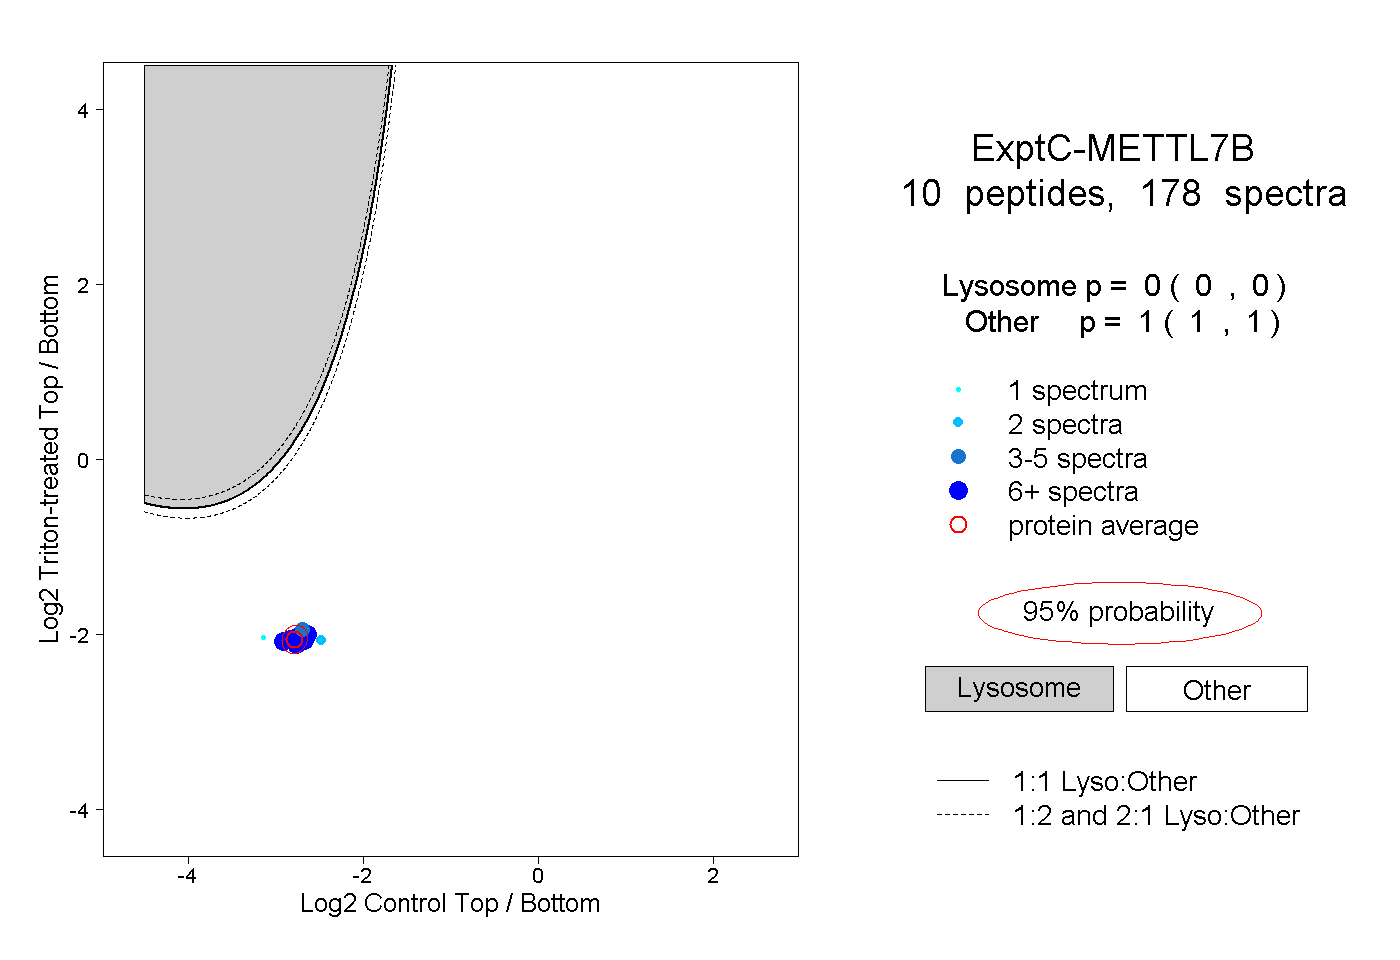 |
0.000 0.000 | 0.000 |
1.000 1.000 | 1.000 |
||||||||
| Plot | Lyso | Other | |||||||||||
| Expt D |
5 peptides |
21 spectra |
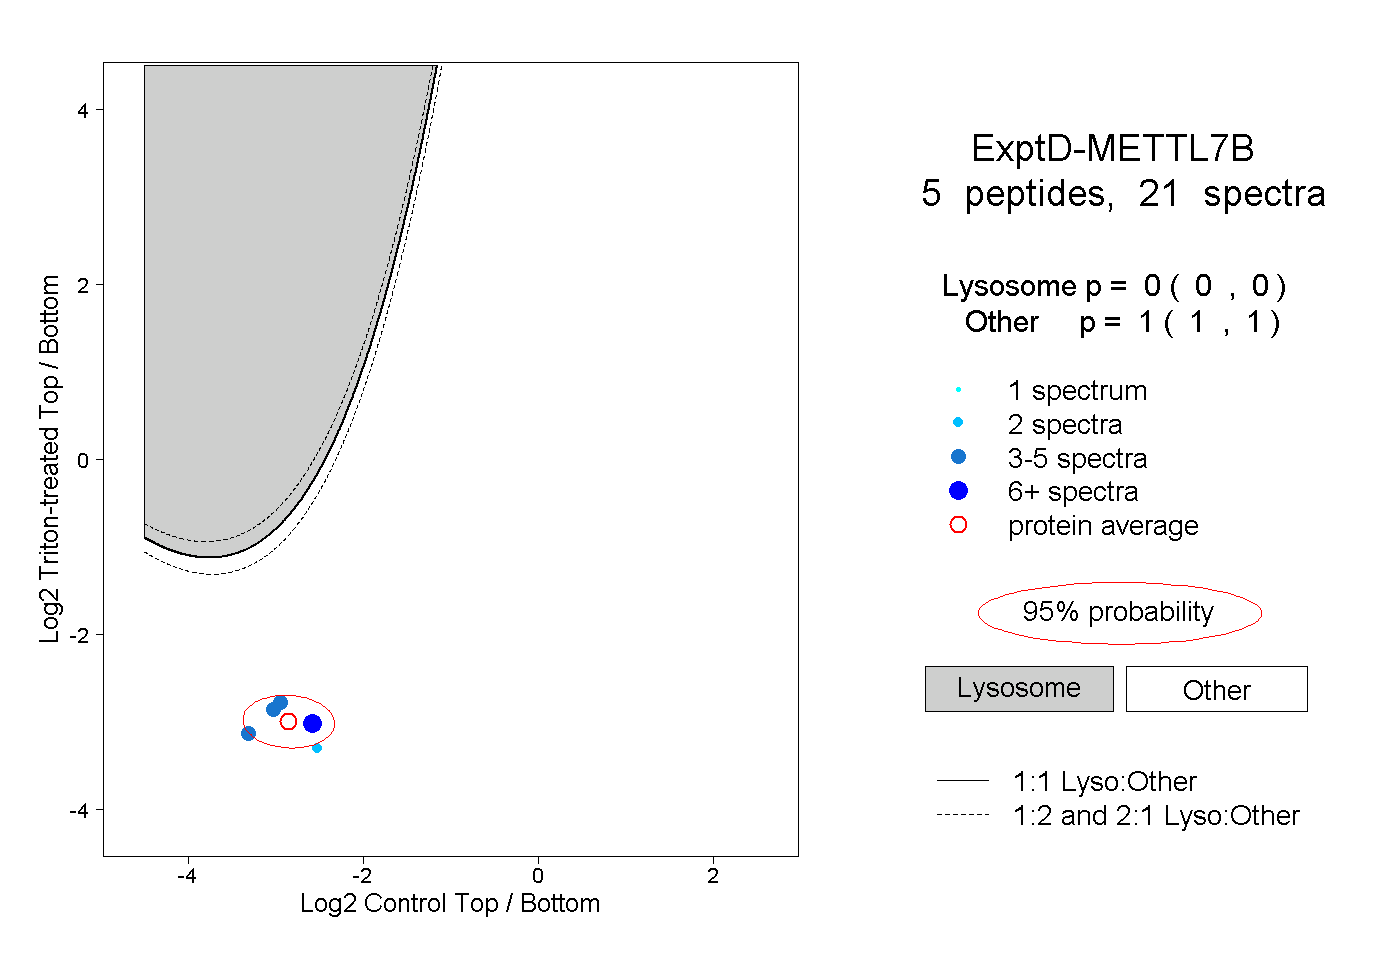 |
0.000 0.000 | 0.000 |
1.000 1.000 | 1.000 |