METTL7B
[ENSRNOP00000010760]
Main page
| | | Plot |
Mito |
Lyso |
|
Perox |
ER |
Golgi |
PM |
Cytosol |
Nucleus |
|
| Expt A |
 11
11
peptides |
173
spectra |
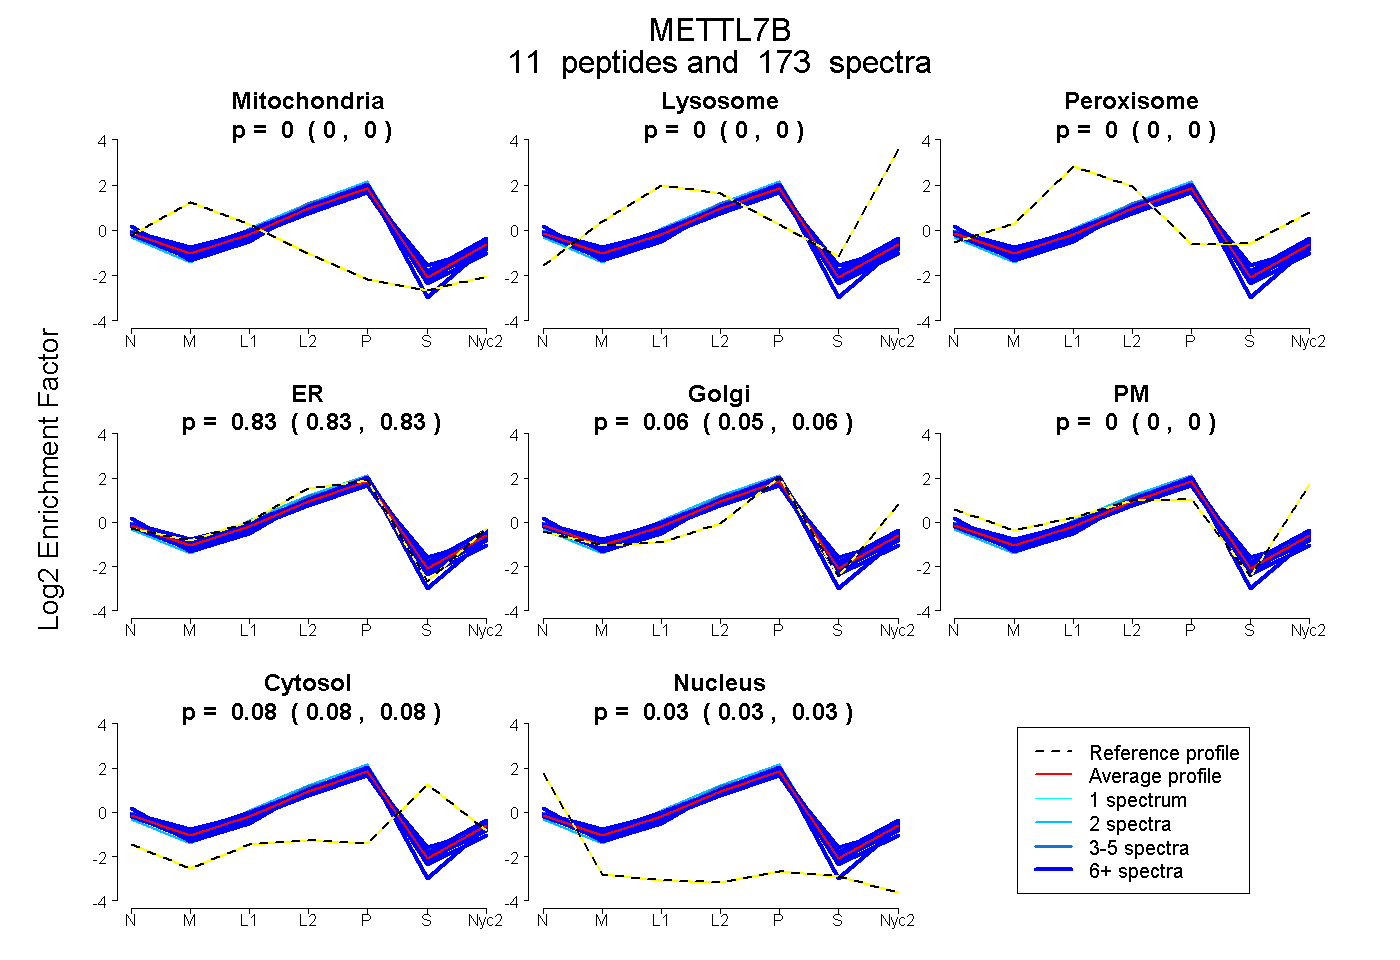 |
0.000
0.000 | 0.000 |
0.000
0.000 | 0.000 |
|
0.000
0.000 | 0.000 |
0.831
0.828 | 0.834 |
0.055
0.051 | 0.059 |
0.000
0.000 | 0.000 |
0.082
0.079 | 0.084 |
0.032
0.030 | 0.033 |
|
| | | Plot |
Mito |
|
Lyso or Perox |
|
ER |
Golgi |
PM |
Cytosol |
Nucleus |
|
| Expt B |
9
peptides |
70
spectra |
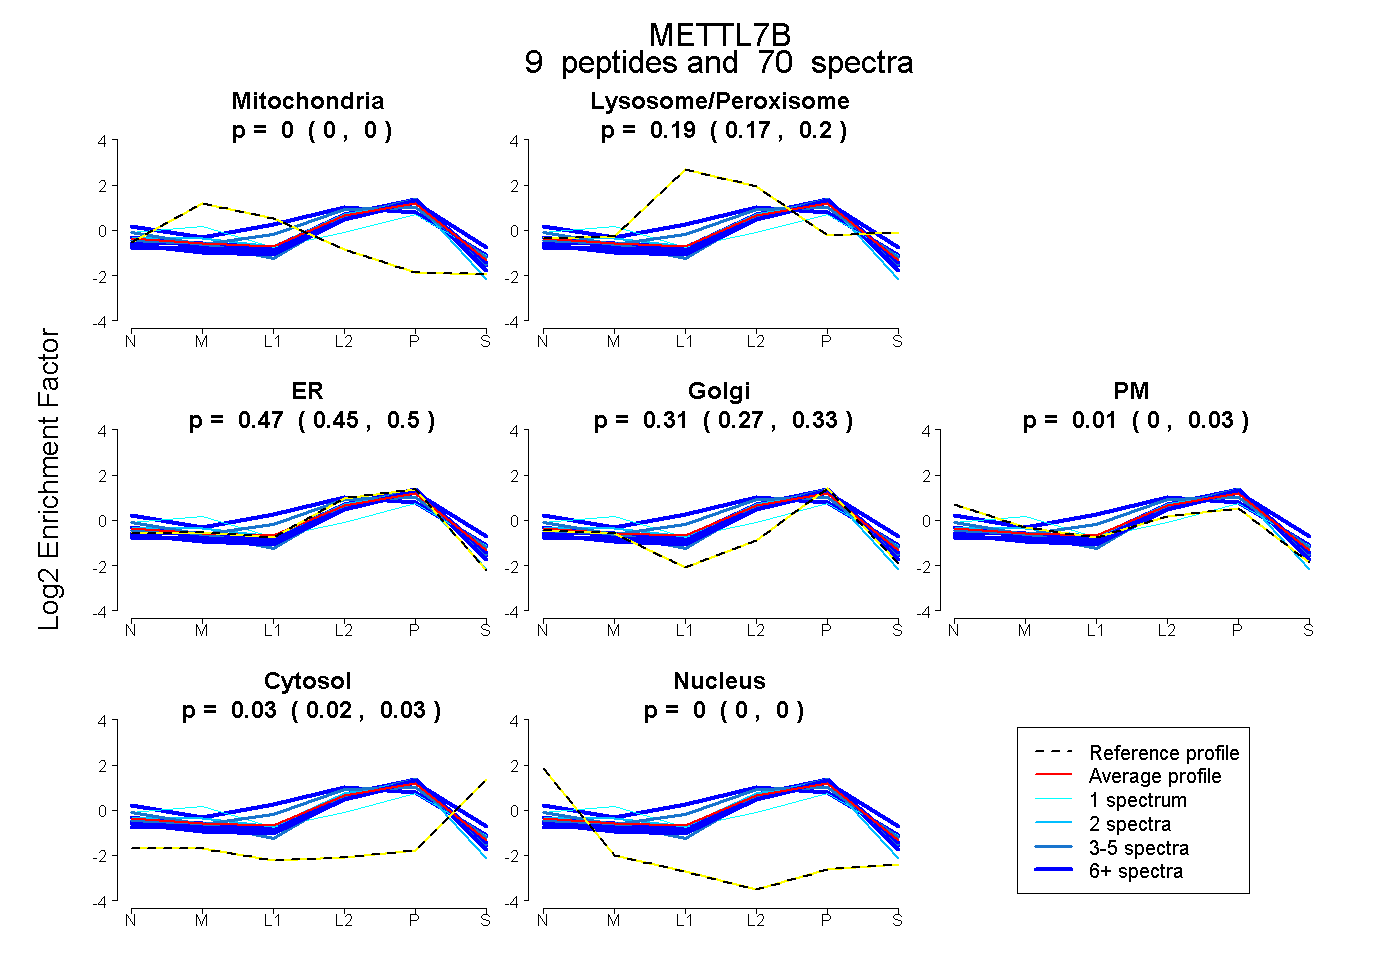 |
0.000
0.000 | 0.000 |
|
0.188
0.172 | 0.200 |
|
0.472
0.446 | 0.495 |
0.306
0.275 | 0.327 |
0.009
0.000 | 0.026 |
0.025
0.017 | 0.032 |
0.000
0.000 | 0.000 |
|
| 4 spectra, VTCVDPNPNFEK |
0.000 |
|
0.267 |
|
0.403 |
0.159 |
0.158 |
0.013 |
0.000 |
|
| 2 spectra, VLEPTWK |
0.019 |
|
0.002 |
|
0.801 |
0.039 |
0.139 |
0.000 |
0.000 |
|
| 14 spectra, ELFSQIK |
0.000 |
|
0.070 |
|
0.672 |
0.196 |
0.050 |
0.011 |
0.000 |
|
| 15 spectra, VLQEVQR |
0.000 |
|
0.100 |
|
0.558 |
0.170 |
0.000 |
0.172 |
0.000 |
|
| 7 spectra, FIVAYGENMK |
0.000 |
|
0.117 |
|
0.633 |
0.226 |
0.000 |
0.023 |
0.000 |
|
| 1 spectrum, HLQYER |
0.084 |
|
0.203 |
|
0.000 |
0.487 |
0.209 |
0.018 |
0.000 |
|
| 12 spectra, HIGDGCHLTR |
0.000 |
|
0.333 |
|
0.231 |
0.033 |
0.404 |
0.000 |
0.000 |
|
| 5 spectra, TYFPYLMATLTAR |
0.000 |
|
0.018 |
|
0.716 |
0.197 |
0.000 |
0.069 |
0.000 |
|
| 10 spectra, WLPVGPHIMGK |
0.000 |
|
0.060 |
|
0.685 |
0.160 |
0.000 |
0.095 |
0.000 |
|
| | | Plot |
|
Lyso |
|
|
|
|
|
|
|
Other |
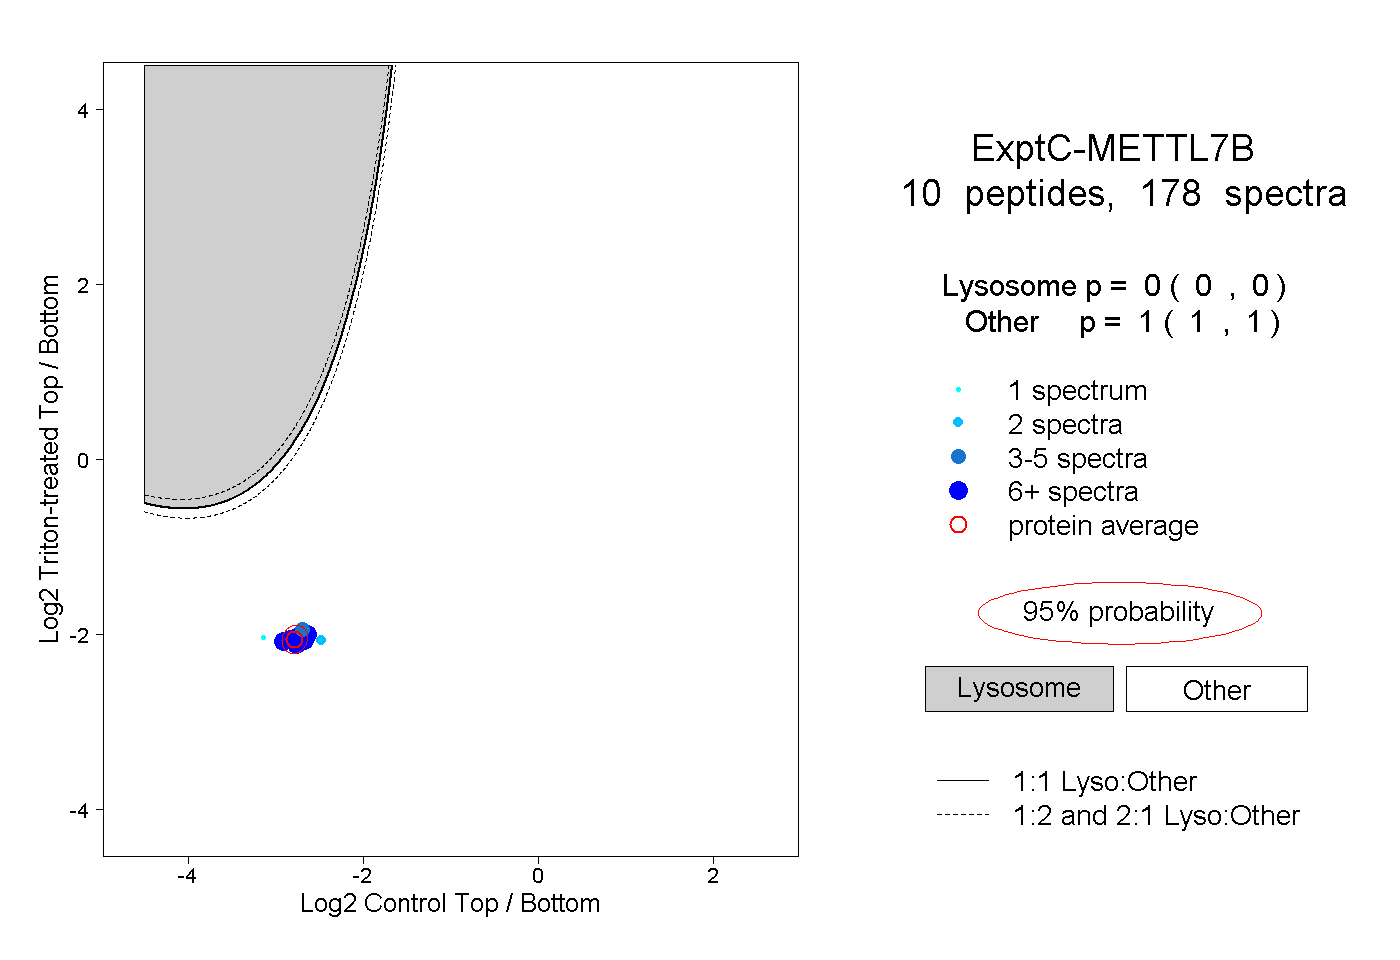
| Expt C |
10
peptides |
178
spectra |
 |
|
0.000
0.000 | 0.000 |
|
|
|
|
|
|
|
1.000
1.000 | 1.000 |
| | | Plot |
|
Lyso |
|
|
|
|
|
|
|
Other |
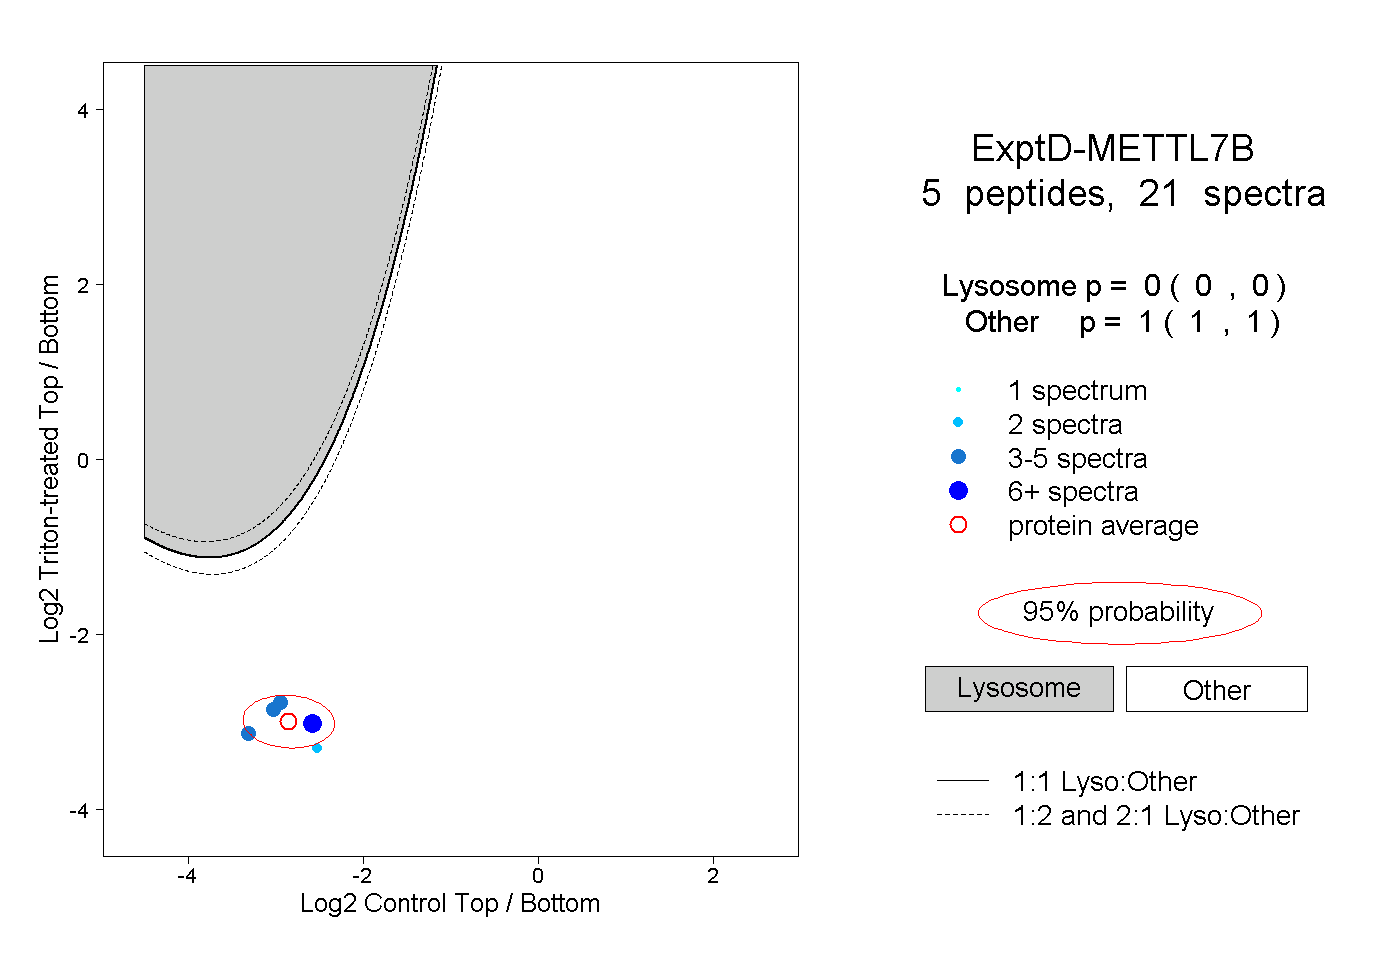
| Expt D |
5
peptides |
21
spectra |
 |
|
0.000
0.000 | 0.000 |
|
|
|
|
|
|
|
1.000
1.000 | 1.000 |