 14
14peptides
spectra
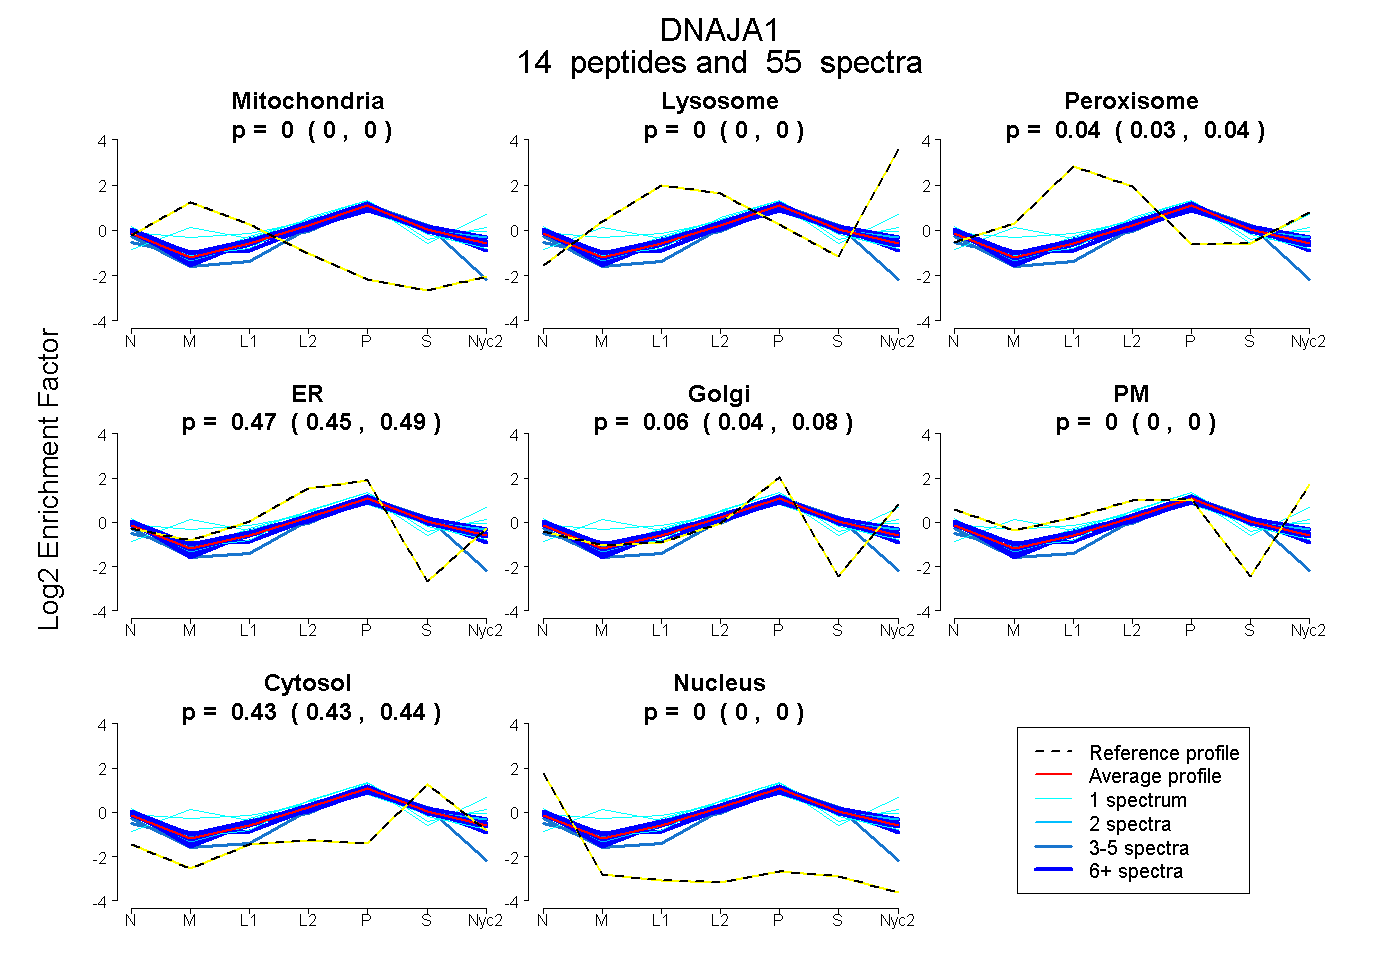
0.000 | 0.000
0.000 | 0.000
0.029 | 0.044
0.448 | 0.487
0.040 | 0.076
0.000 | 0.000
0.428 | 0.439
0.000 | 0.000
9peptides
spectra
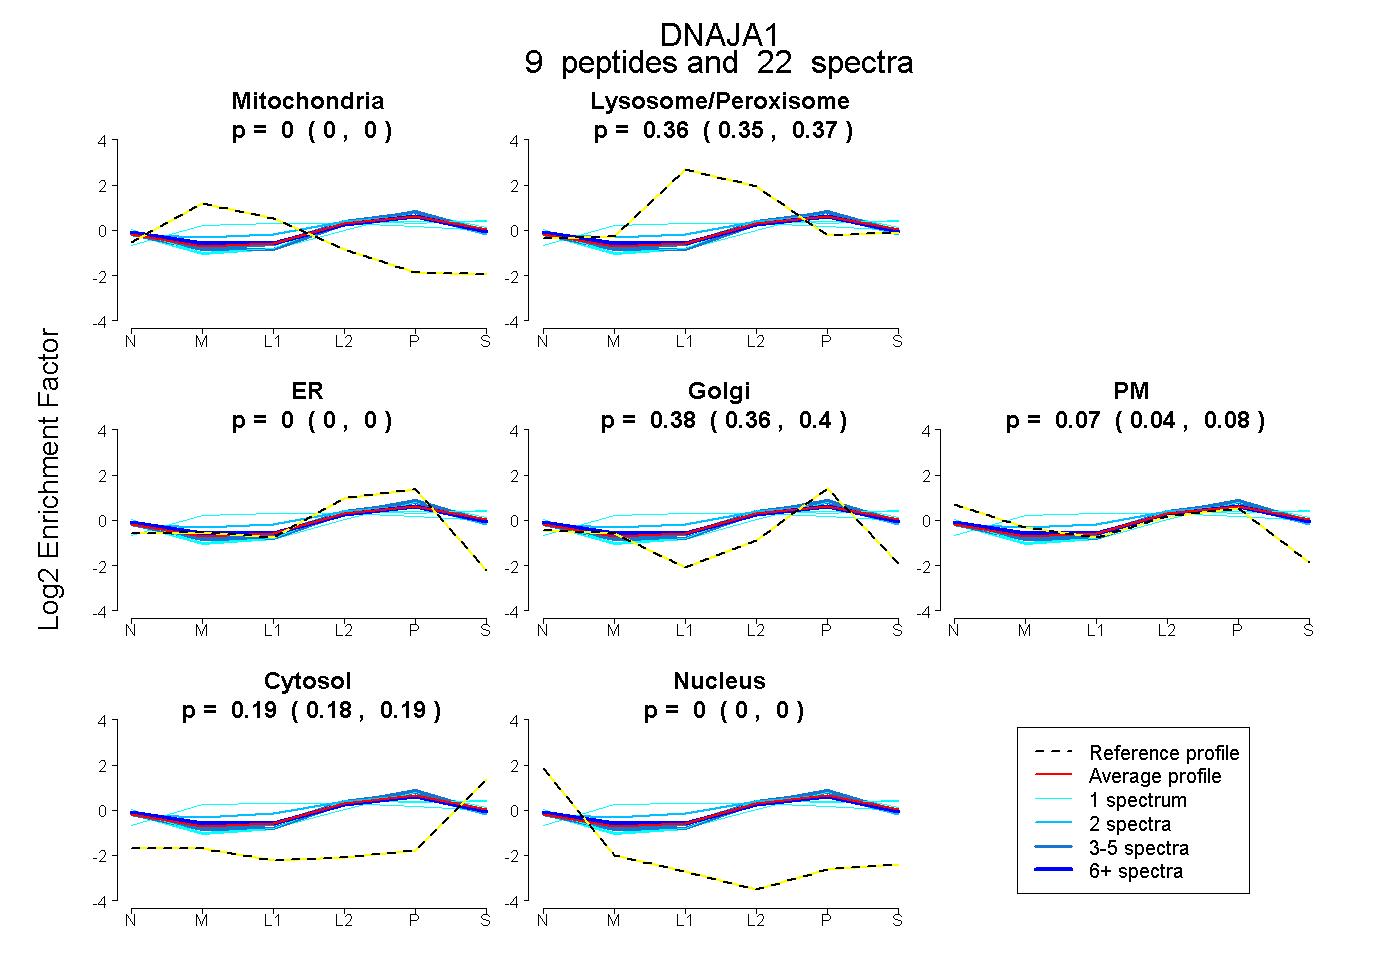
0.000 | 0.000
0.353 | 0.371
0.000 | 0.000
0.365 | 0.400
0.043 | 0.085
0.181 | 0.193
0.000 | 0.000
14peptides
spectra

0.000 | 0.000
1.000 | 1.000
7peptides
spectra
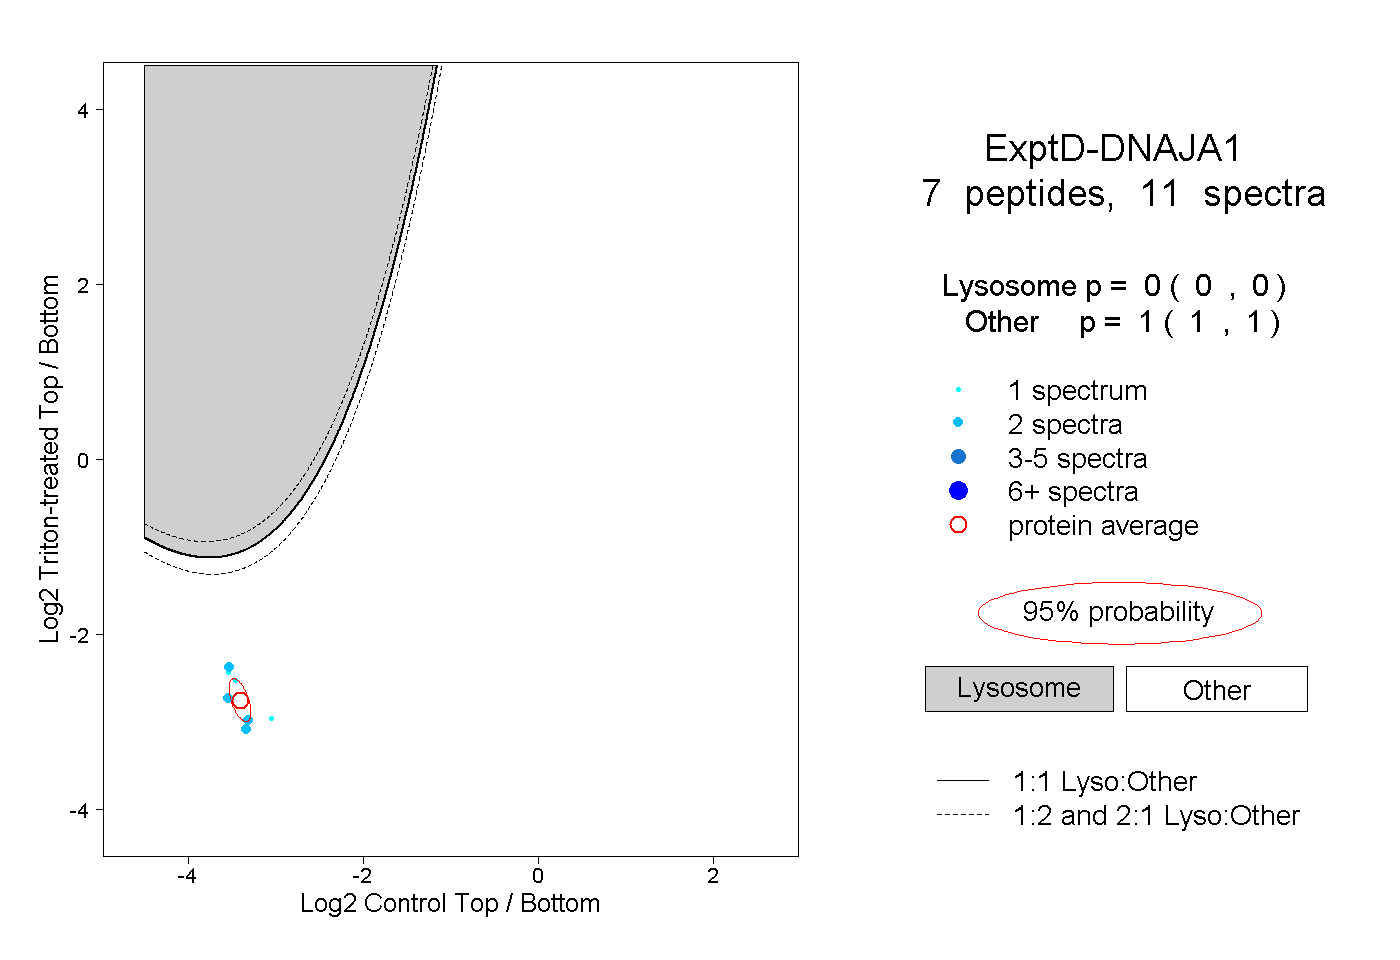
0.000 | 0.000
1.000 | 1.000