 14
14peptides
spectra
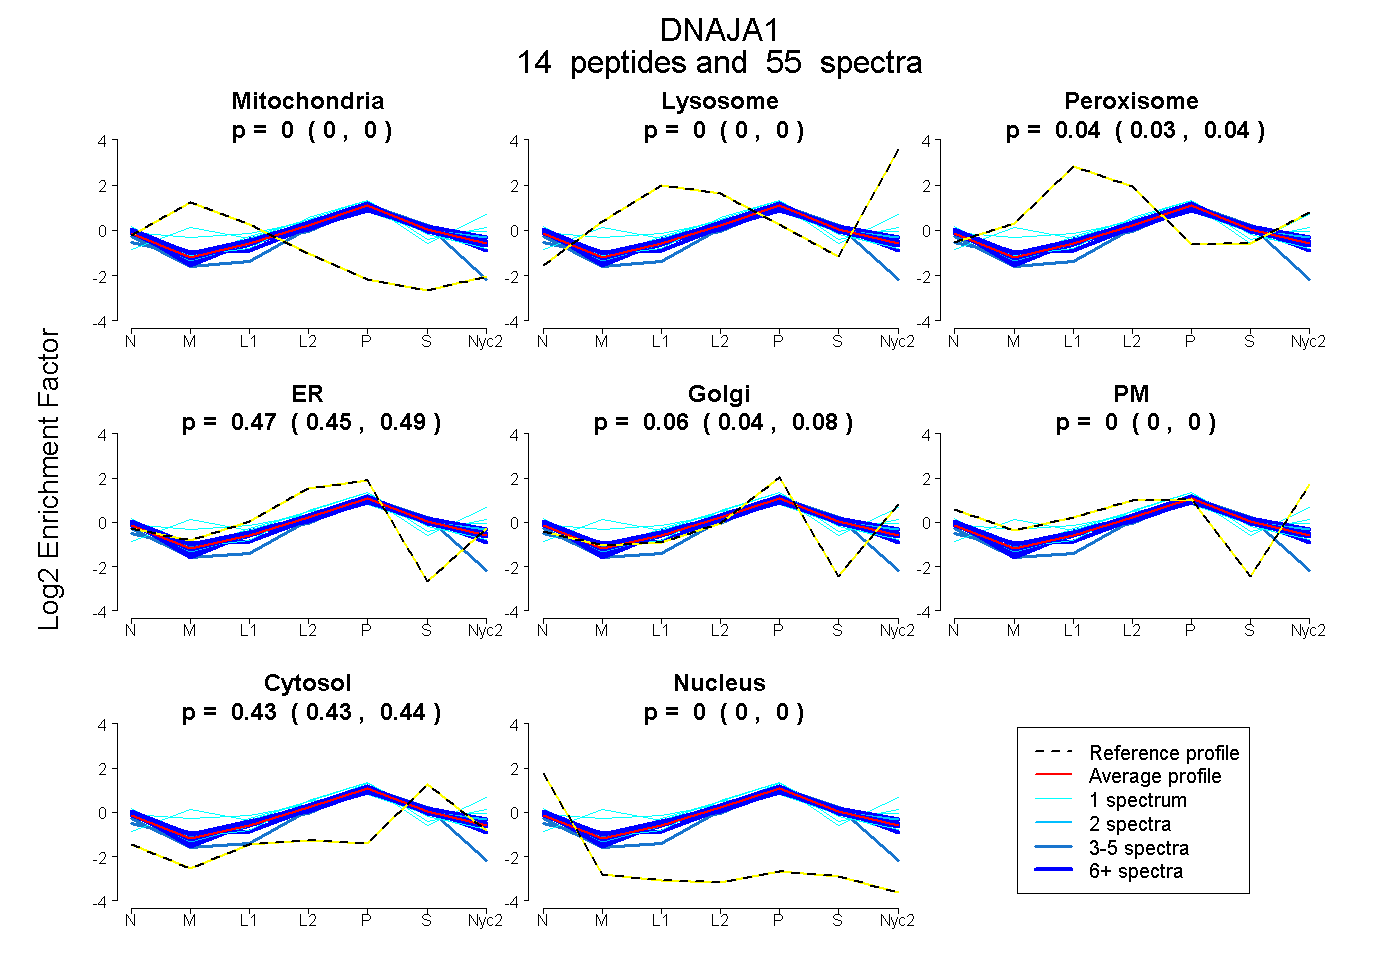
0.000 | 0.000
0.000 | 0.000
0.029 | 0.044
0.448 | 0.487
0.040 | 0.076
0.000 | 0.000
0.428 | 0.439
0.000 | 0.000
| Plot | Mito | Lyso | Perox | ER | Golgi | PM | Cytosol | Nucleus | |||||
| Expt A |
14 peptides |
55 spectra |
|
0.000 0.000 | 0.000 |
0.000 0.000 | 0.000 |
0.037 0.029 | 0.044 |
0.469 0.448 | 0.487 |
0.060 0.040 | 0.076 |
0.000 0.000 | 0.000 |
0.434 0.428 | 0.439 |
0.000 0.000 | 0.000 |
| 1 spectrum, DHAVFTR | 0.000 | 0.000 | 0.239 | 0.000 | 0.438 | 0.158 | 0.166 | 0.000 | ||
| 10 spectra, CVLNEGMPIYR | 0.000 | 0.000 | 0.018 | 0.527 | 0.000 | 0.006 | 0.450 | 0.000 | ||
| 1 spectrum, NVVHQLSVTLEDLYNGATR | 0.000 | 0.000 | 0.000 | 0.603 | 0.000 | 0.000 | 0.397 | 0.000 | ||
| 7 spectra, TIVITSHPGQIVK | 0.000 | 0.000 | 0.027 | 0.535 | 0.019 | 0.000 | 0.419 | 0.000 | ||
| 4 spectra, GAVECCPNCR | 0.000 | 0.000 | 0.000 | 0.441 | 0.000 | 0.000 | 0.489 | 0.070 | ||
| 2 spectra, NPNEGEK | 0.000 | 0.000 | 0.003 | 0.389 | 0.053 | 0.123 | 0.432 | 0.000 | ||
| 1 spectrum, HYNGEAYEDDEHHPR | 0.000 | 0.000 | 0.066 | 0.285 | 0.244 | 0.030 | 0.375 | 0.000 | ||
| 1 spectrum, GGVQCQTS | 0.084 | 0.000 | 0.153 | 0.429 | 0.000 | 0.000 | 0.334 | 0.000 | ||
| 1 spectrum, GTGMQIR | 0.000 | 0.000 | 0.028 | 0.332 | 0.073 | 0.253 | 0.314 | 0.000 | ||
| 6 spectra, NVICDK | 0.000 | 0.000 | 0.000 | 0.507 | 0.000 | 0.000 | 0.493 | 0.000 | ||
| 6 spectra, QISQAYEVLADSK | 0.000 | 0.000 | 0.086 | 0.346 | 0.115 | 0.035 | 0.418 | 0.000 | ||
| 6 spectra, LLLEFK | 0.000 | 0.000 | 0.000 | 0.527 | 0.000 | 0.019 | 0.454 | 0.000 | ||
| 3 spectra, GGEQAIK | 0.000 | 0.000 | 0.080 | 0.326 | 0.145 | 0.000 | 0.449 | 0.000 | ||
| 6 spectra, ILEVHIDK | 0.000 | 0.000 | 0.039 | 0.365 | 0.091 | 0.059 | 0.446 | 0.000 |
| Plot | Mito | Lyso or Perox | ER | Golgi | PM | Cytosol | Nucleus | ||||||
| Expt B |
9 peptides |
22 spectra |
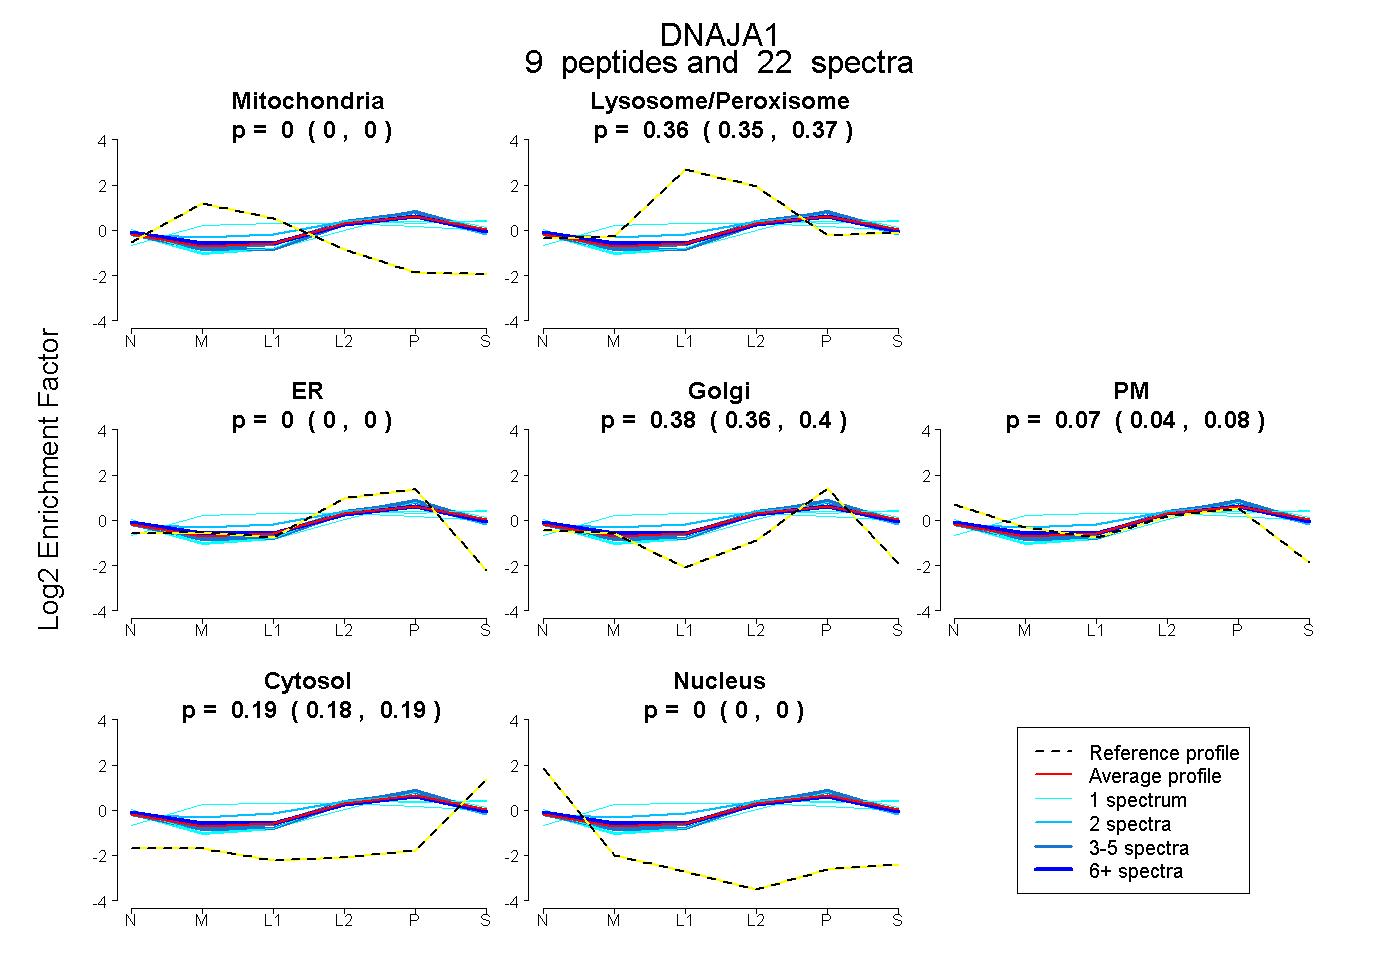 |
0.000 0.000 | 0.000 |
0.363 0.353 | 0.371 |
0.000 0.000 | 0.000 |
0.383 0.365 | 0.400 |
0.066 0.043 | 0.085 |
0.187 0.181 | 0.193 |
0.000 0.000 | 0.000 |
|||
| Plot | Lyso | Other | |||||||||||
| Expt C |
14 peptides |
91 spectra |
 |
0.000 0.000 | 0.000 |
1.000 1.000 | 1.000 |
||||||||
| Plot | Lyso | Other | |||||||||||
| Expt D |
7 peptides |
11 spectra |
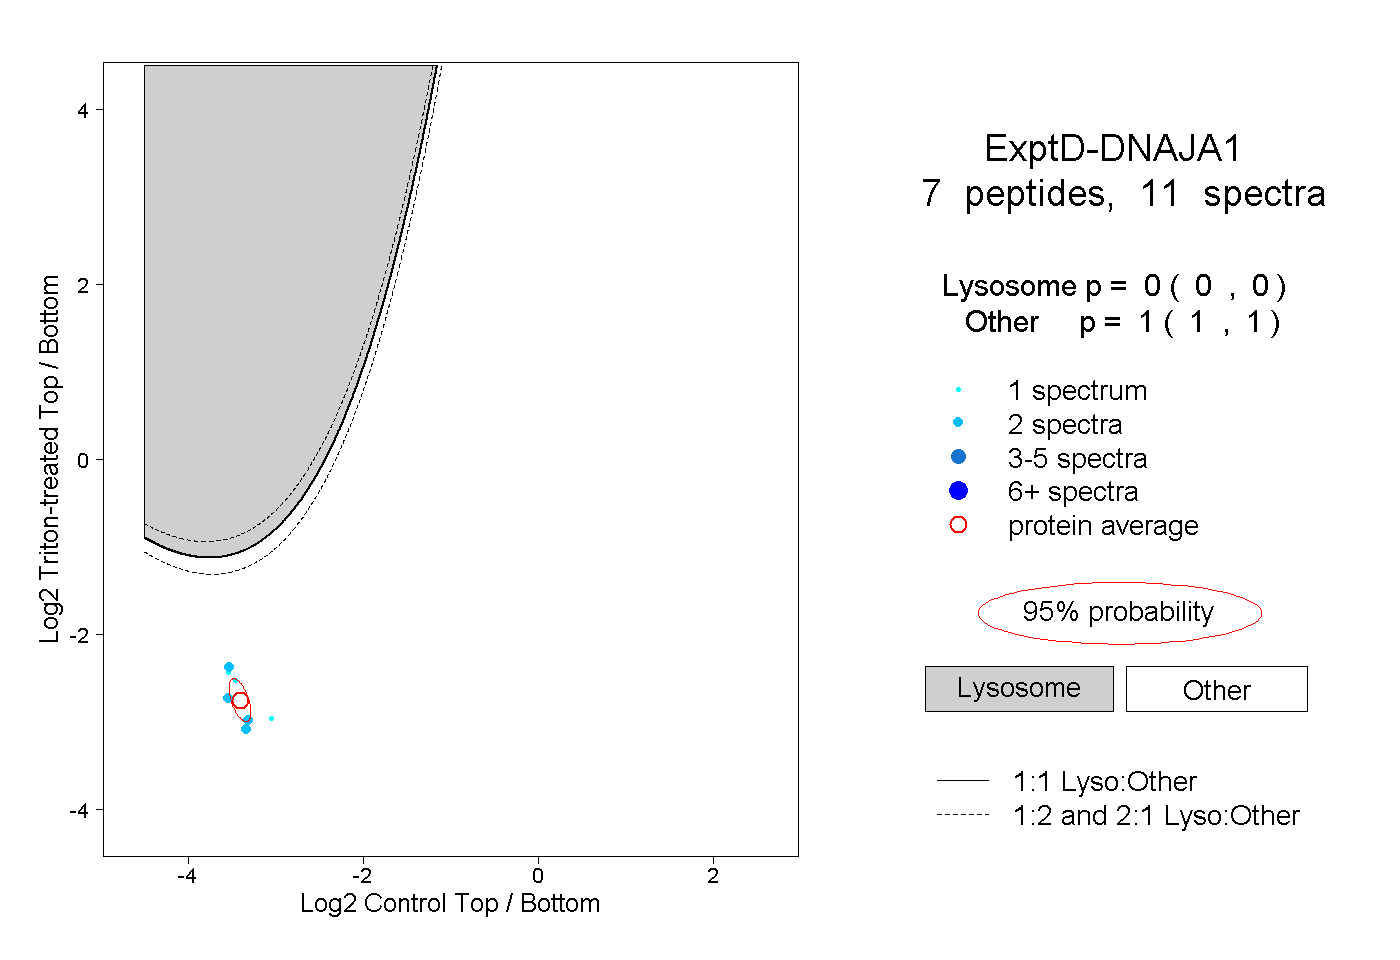 |
0.000 0.000 | 0.000 |
1.000 1.000 | 1.000 |