 14
14peptides
spectra
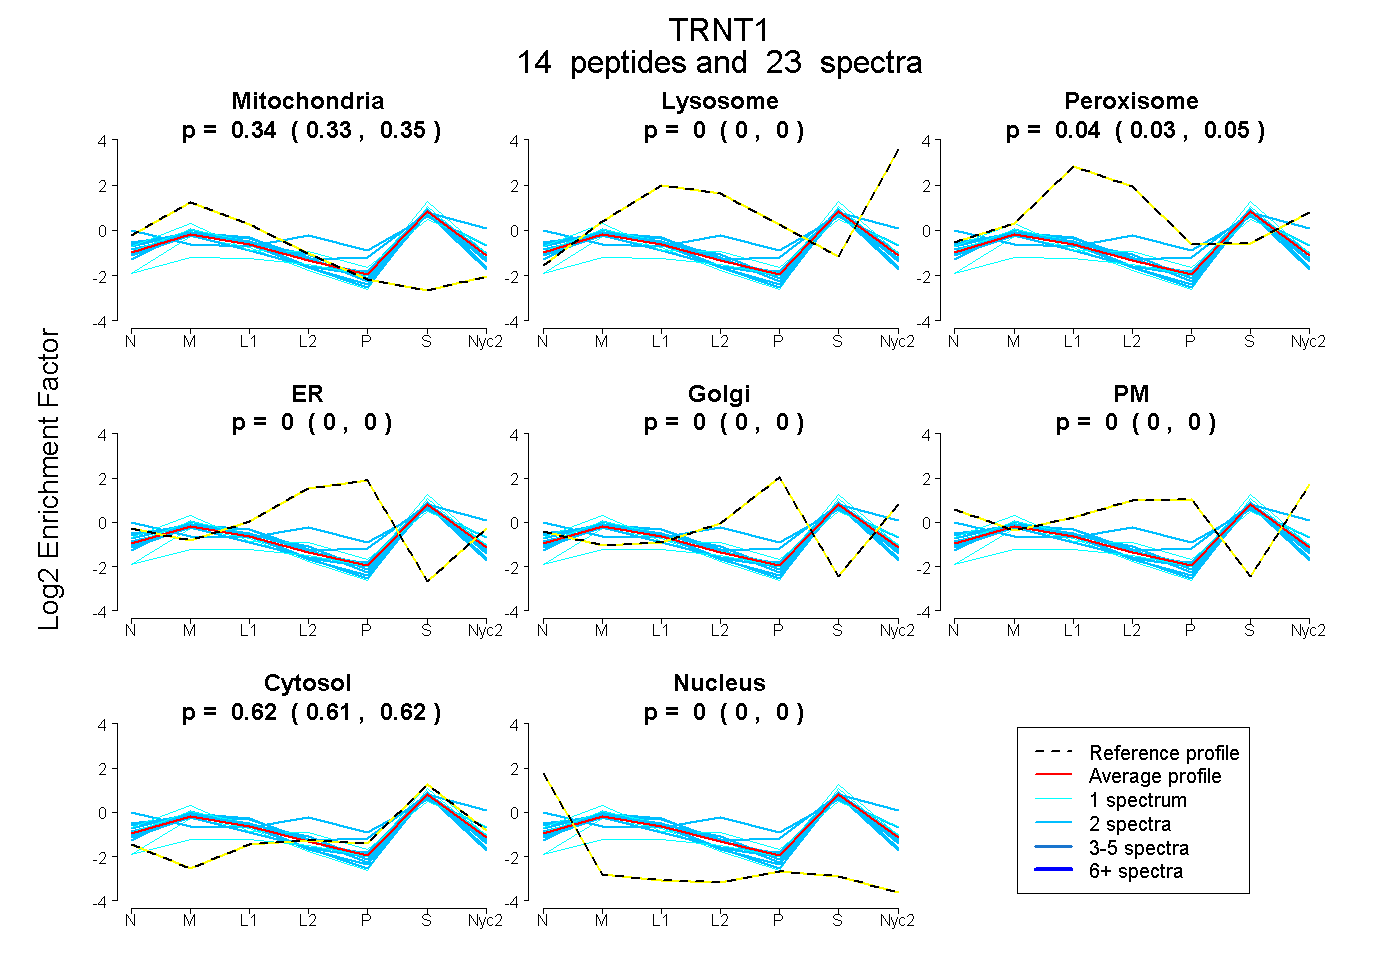
0.332 | 0.347
0.000 | 0.000
0.034 | 0.048
0.000 | 0.000
0.000 | 0.000
0.000 | 0.000
0.613 | 0.623
0.000 | 0.000
5peptides
spectra
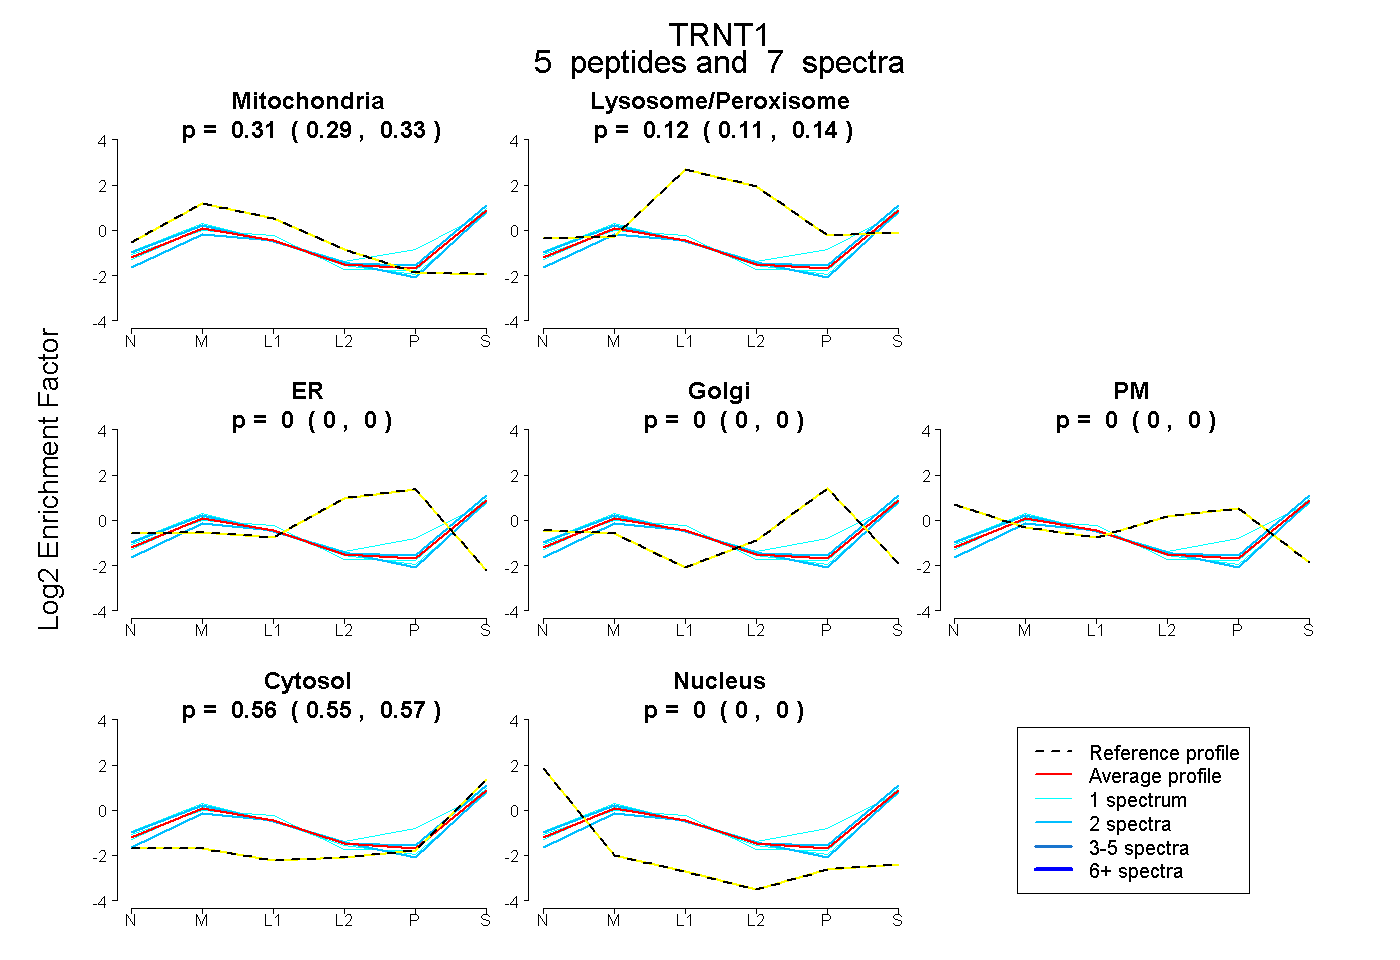
0.294 | 0.331
0.106 | 0.137
0.000 | 0.000
0.000 | 0.000
0.000 | 0.000
0.553 | 0.572
0.000 | 0.000
16peptides
spectra
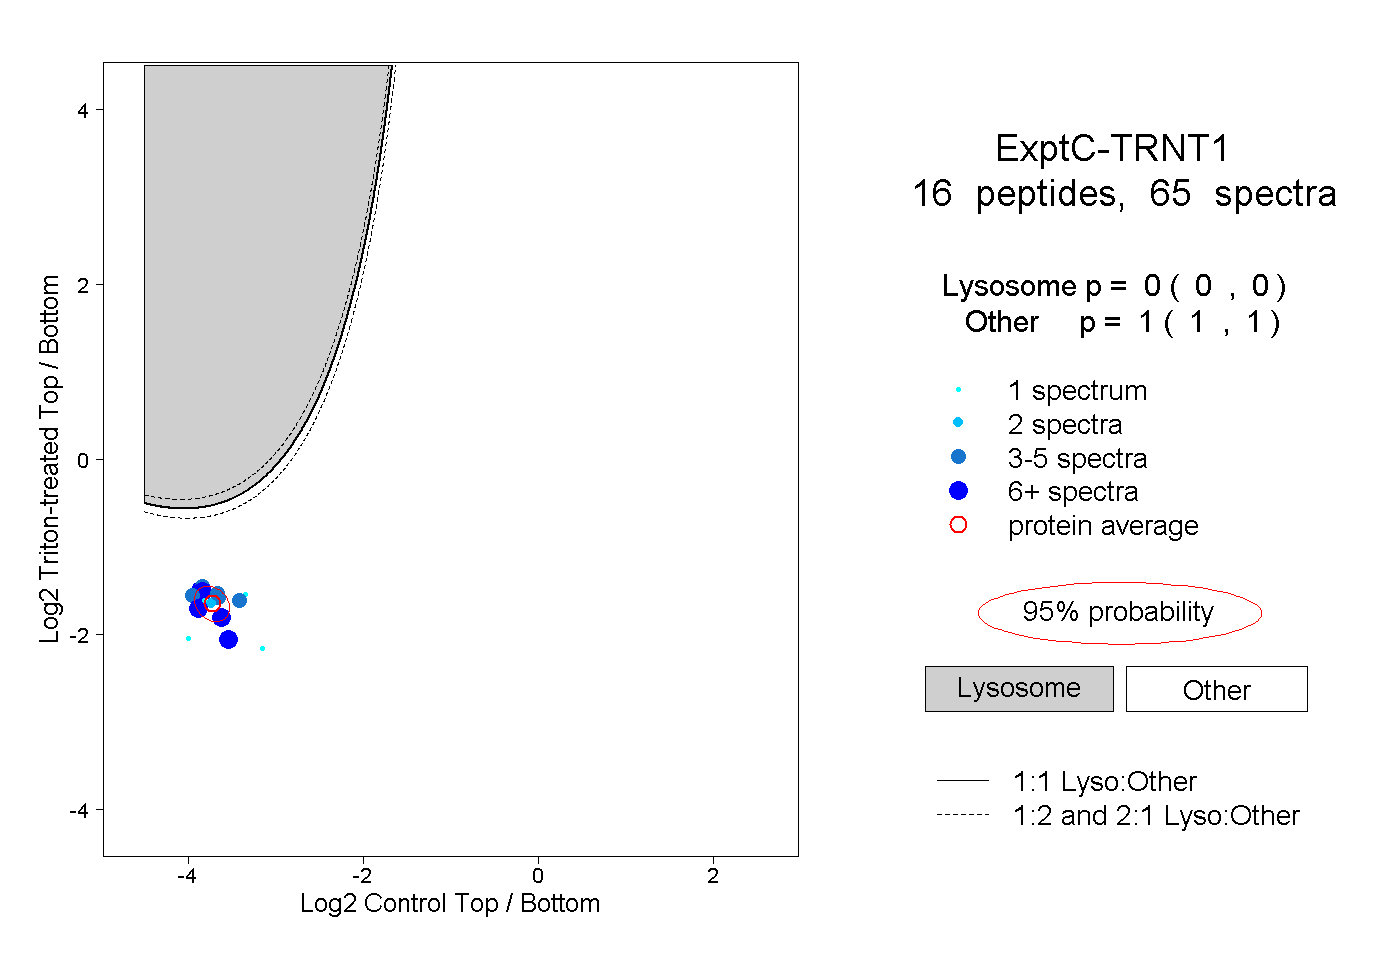
0.000 | 0.000
1.000 | 1.000
2peptides
spectra
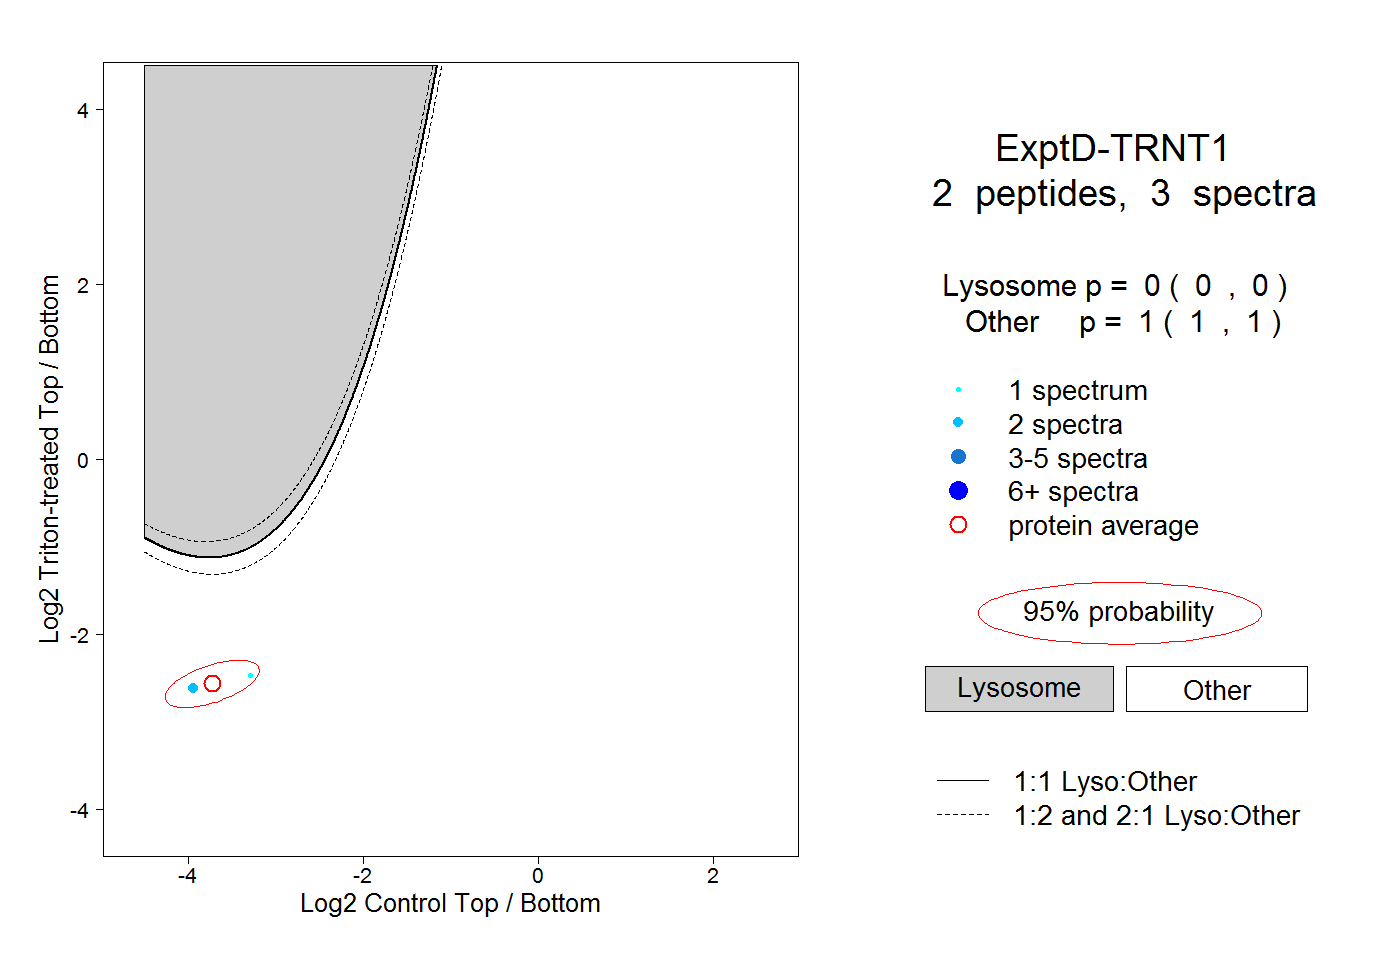
0.000 | 0.000
1.000 | 1.000