 14
14peptides
spectra
0.332 | 0.347
0.000 | 0.000
0.034 | 0.048
0.000 | 0.000
0.000 | 0.000
0.000 | 0.000
0.613 | 0.623
0.000 | 0.000
| Plot | Mito | Lyso | Perox | ER | Golgi | PM | Cytosol | Nucleus | |||||
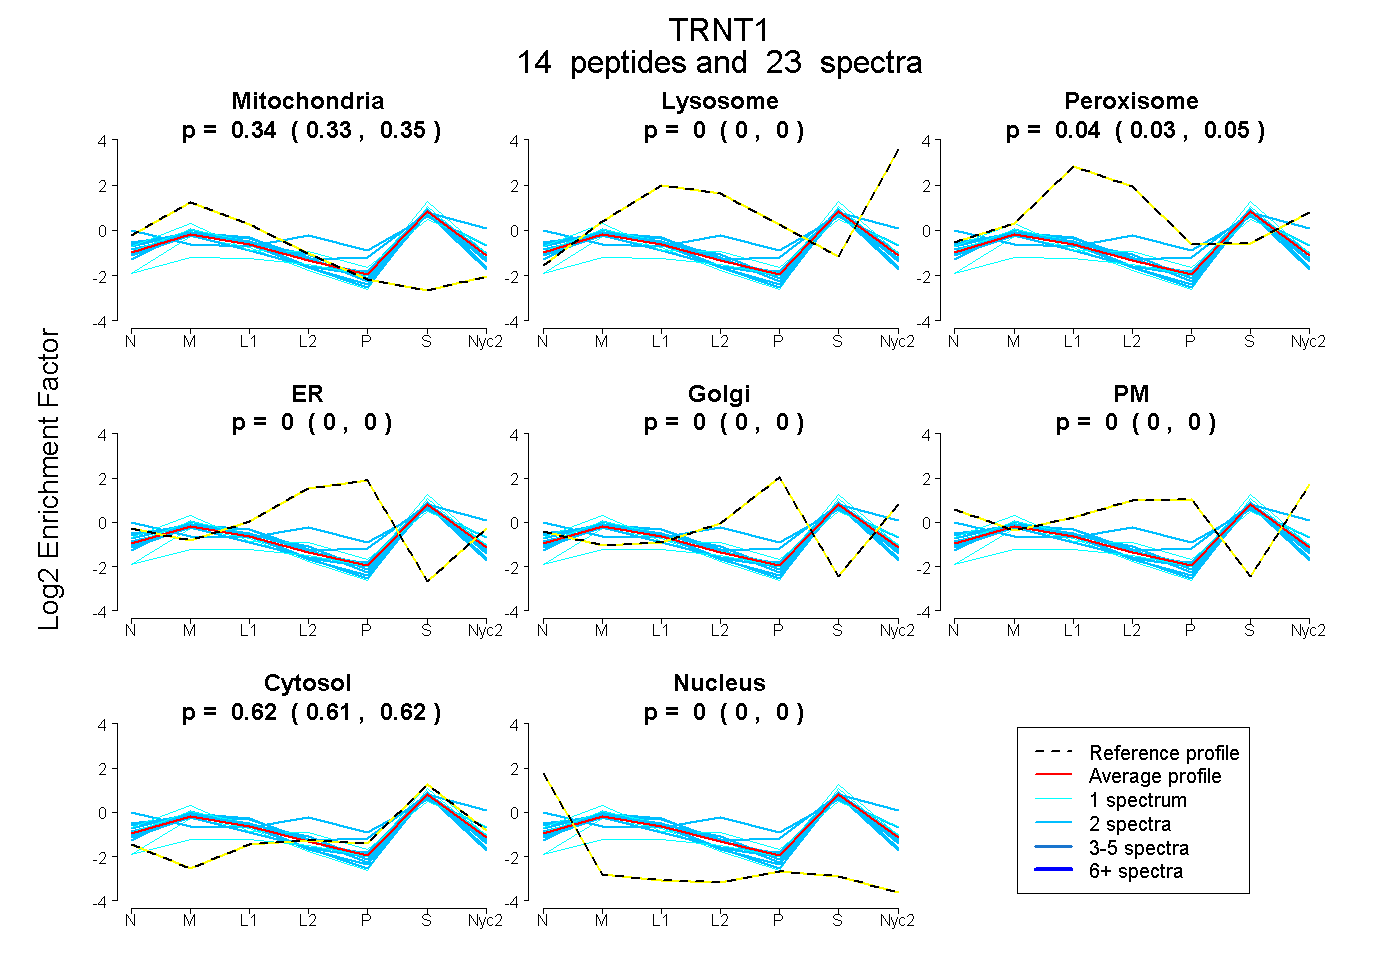
| Expt A |
14 peptides |
23 spectra |
|
0.340 0.332 | 0.347 |
0.000 0.000 | 0.000 |
0.041 0.034 | 0.048 |
0.000 0.000 | 0.000 |
0.000 0.000 | 0.000 |
0.000 0.000 | 0.000 |
0.619 0.613 | 0.623 |
0.000 0.000 | 0.000 |
| 2 spectra, IVDKPGDHDR | 0.150 | 0.000 | 0.158 | 0.000 | 0.000 | 0.128 | 0.555 | 0.009 | ||
| 2 spectra, FVGHAK | 0.365 | 0.000 | 0.076 | 0.000 | 0.000 | 0.000 | 0.559 | 0.000 | ||
| 2 spectra, IAGGAVR | 0.348 | 0.000 | 0.000 | 0.000 | 0.000 | 0.000 | 0.652 | 0.000 | ||
| 1 spectrum, LHEENFEVTTLR | 0.151 | 0.000 | 0.000 | 0.000 | 0.000 | 0.000 | 0.849 | 0.000 | ||
| 2 spectra, EPDATAR | 0.419 | 0.000 | 0.000 | 0.000 | 0.000 | 0.000 | 0.581 | 0.000 | ||
| 2 spectra, IDVSTDGR | 0.355 | 0.000 | 0.054 | 0.000 | 0.000 | 0.000 | 0.591 | 0.000 | ||
| 1 spectrum, NLGLFIVK | 0.380 | 0.102 | 0.000 | 0.000 | 0.000 | 0.000 | 0.518 | 0.000 | ||
| 2 spectra, GLAGISGER | 0.328 | 0.000 | 0.084 | 0.000 | 0.000 | 0.000 | 0.588 | 0.000 | ||
| 2 spectra, YQGEHALLK | 0.211 | 0.201 | 0.000 | 0.000 | 0.000 | 0.000 | 0.588 | 0.000 | ||
| 2 spectra, IWVELK | 0.397 | 0.000 | 0.000 | 0.000 | 0.000 | 0.000 | 0.603 | 0.000 | ||
| 2 spectra, IQEDYLR | 0.412 | 0.000 | 0.003 | 0.000 | 0.000 | 0.000 | 0.585 | 0.000 | ||
| 1 spectrum, EIGALLQQLR | 0.405 | 0.000 | 0.000 | 0.000 | 0.000 | 0.000 | 0.595 | 0.000 | ||
| 1 spectrum, VCELLK | 0.356 | 0.000 | 0.072 | 0.000 | 0.000 | 0.000 | 0.572 | 0.000 | ||
| 1 spectrum, ETLEAIAENAK | 0.312 | 0.000 | 0.000 | 0.000 | 0.000 | 0.000 | 0.688 | 0.000 |
| Plot | Mito | Lyso or Perox | ER | Golgi | PM | Cytosol | Nucleus | ||||||
| Expt B |
5 peptides |
7 spectra |
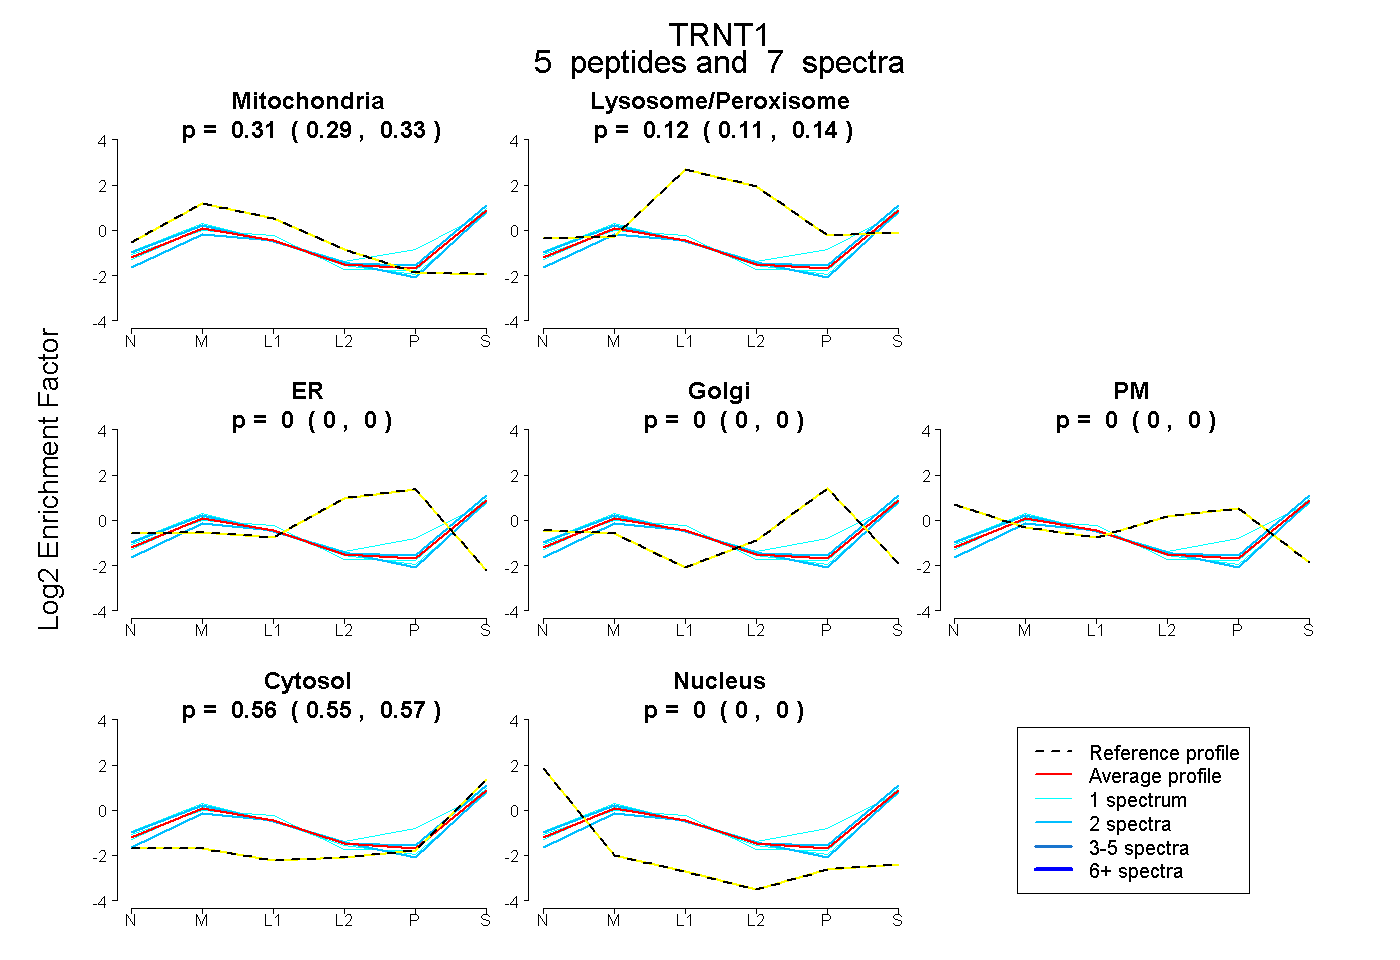 |
0.314 0.294 | 0.331 |
0.123 0.106 | 0.137 |
0.000 0.000 | 0.000 |
0.000 0.000 | 0.000 |
0.000 0.000 | 0.000 |
0.563 0.553 | 0.572 |
0.000 0.000 | 0.000 |
|||
| Plot | Lyso | Other | |||||||||||
| Expt C |
16 peptides |
65 spectra |
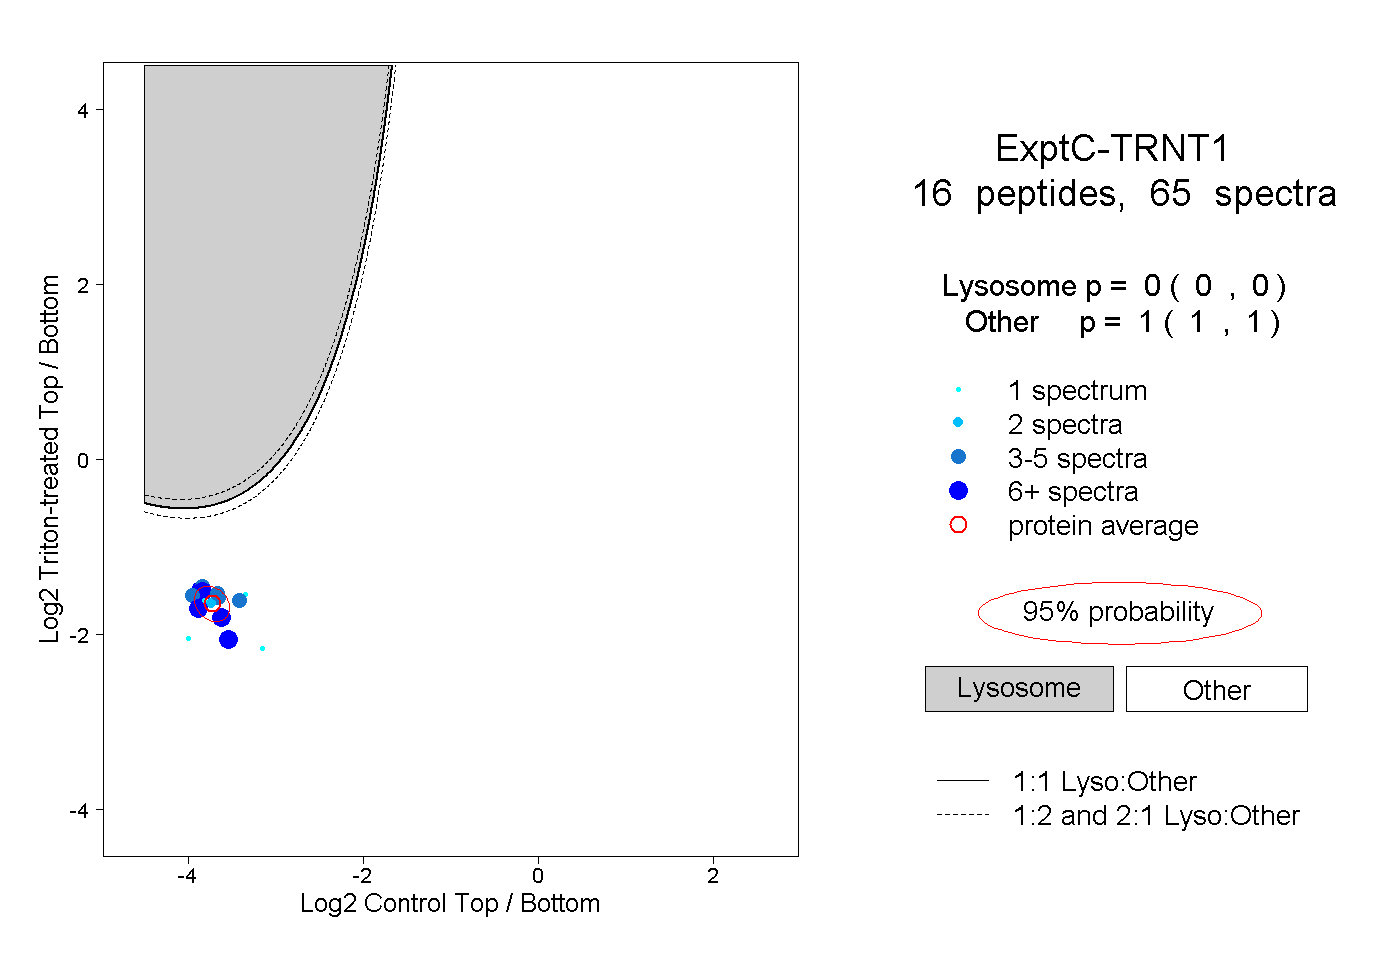 |
0.000 0.000 | 0.000 |
1.000 1.000 | 1.000 |
||||||||
| Plot | Lyso | Other | |||||||||||
| Expt D |
2 peptides |
3 spectra |
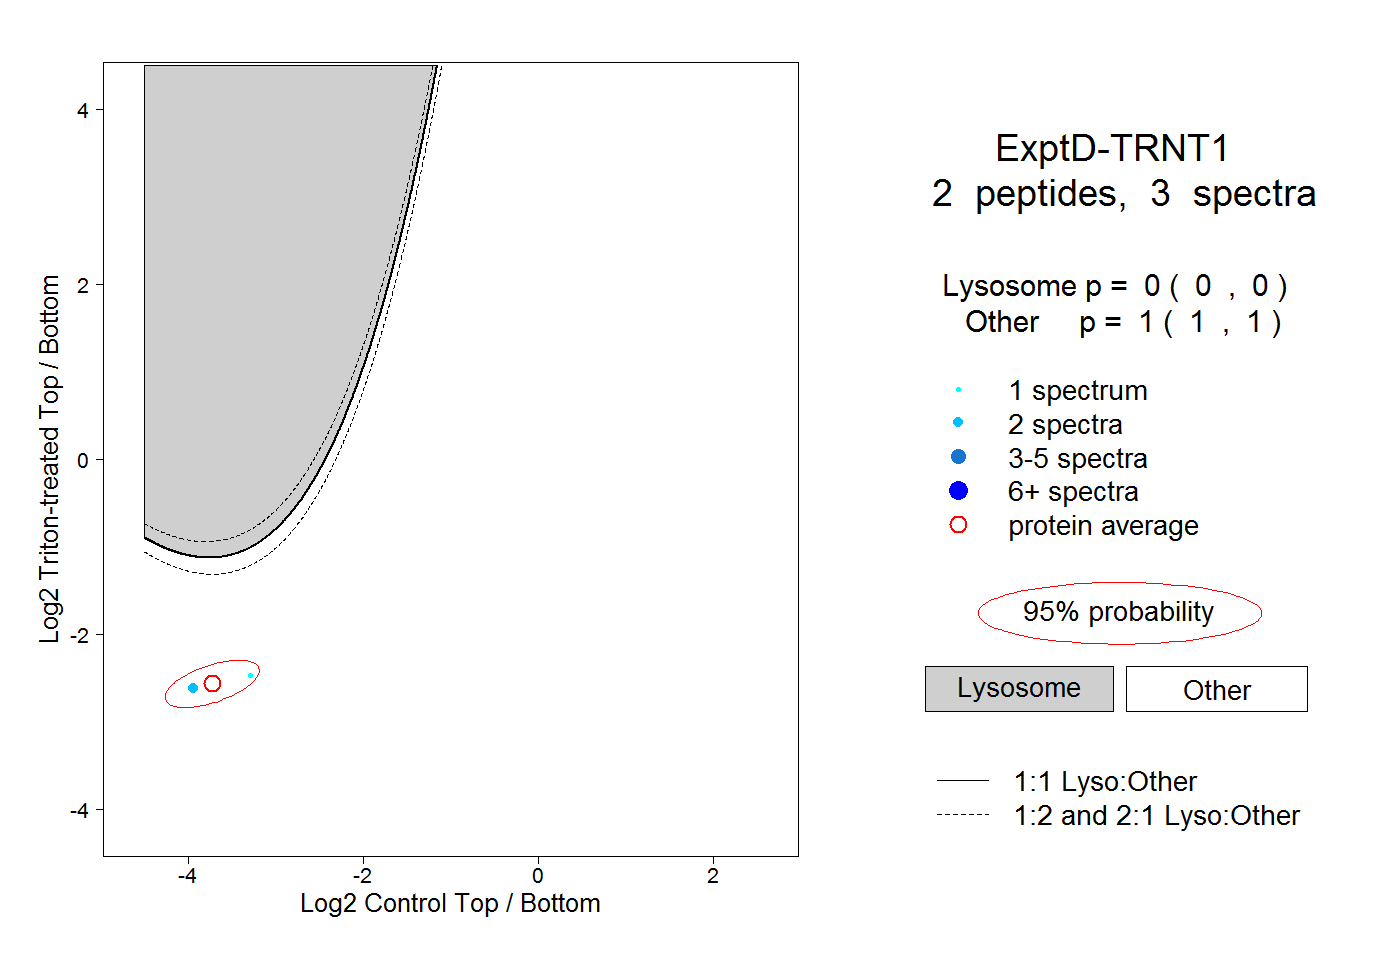 |
0.000 0.000 | 0.000 |
1.000 1.000 | 1.000 |