TRNT1
[ENSRNOP00000008527]
Main page
| | | Plot |
Mito |
Lyso |
|
Perox |
ER |
Golgi |
PM |
Cytosol |
Nucleus |
|
| Expt A |
 14
14
peptides |
23
spectra |
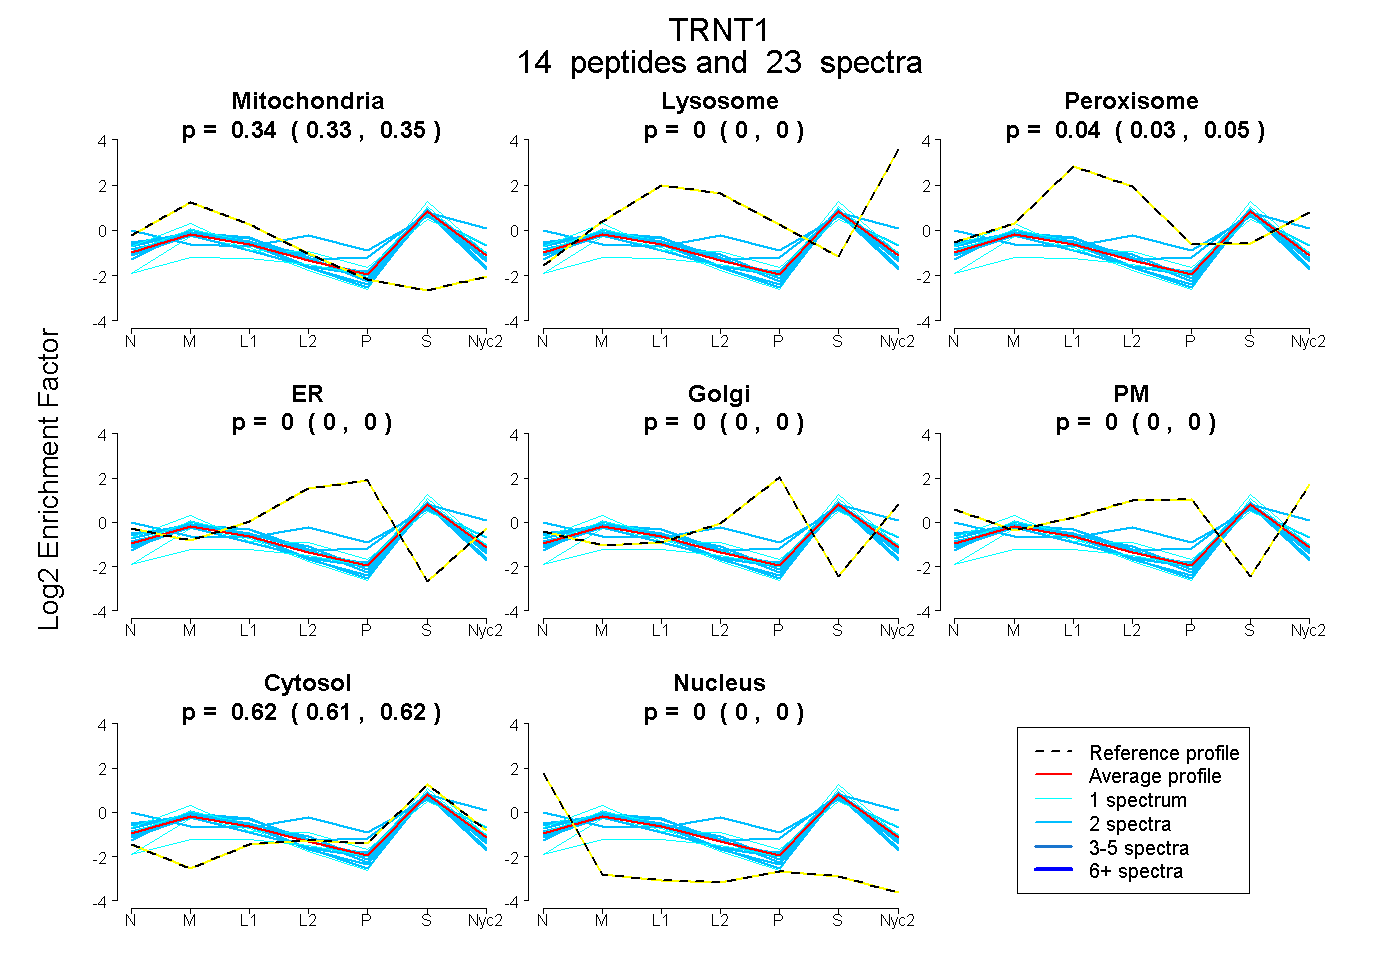 |
0.340
0.332 | 0.347 |
0.000
0.000 | 0.000 |
|
0.041
0.034 | 0.048 |
0.000
0.000 | 0.000 |
0.000
0.000 | 0.000 |
0.000
0.000 | 0.000 |
0.619
0.613 | 0.623 |
0.000
0.000 | 0.000 |
|
| | | Plot |
Mito |
|
Lyso or Perox |
|
ER |
Golgi |
PM |
Cytosol |
Nucleus |
|
| Expt B |
5
peptides |
7
spectra |
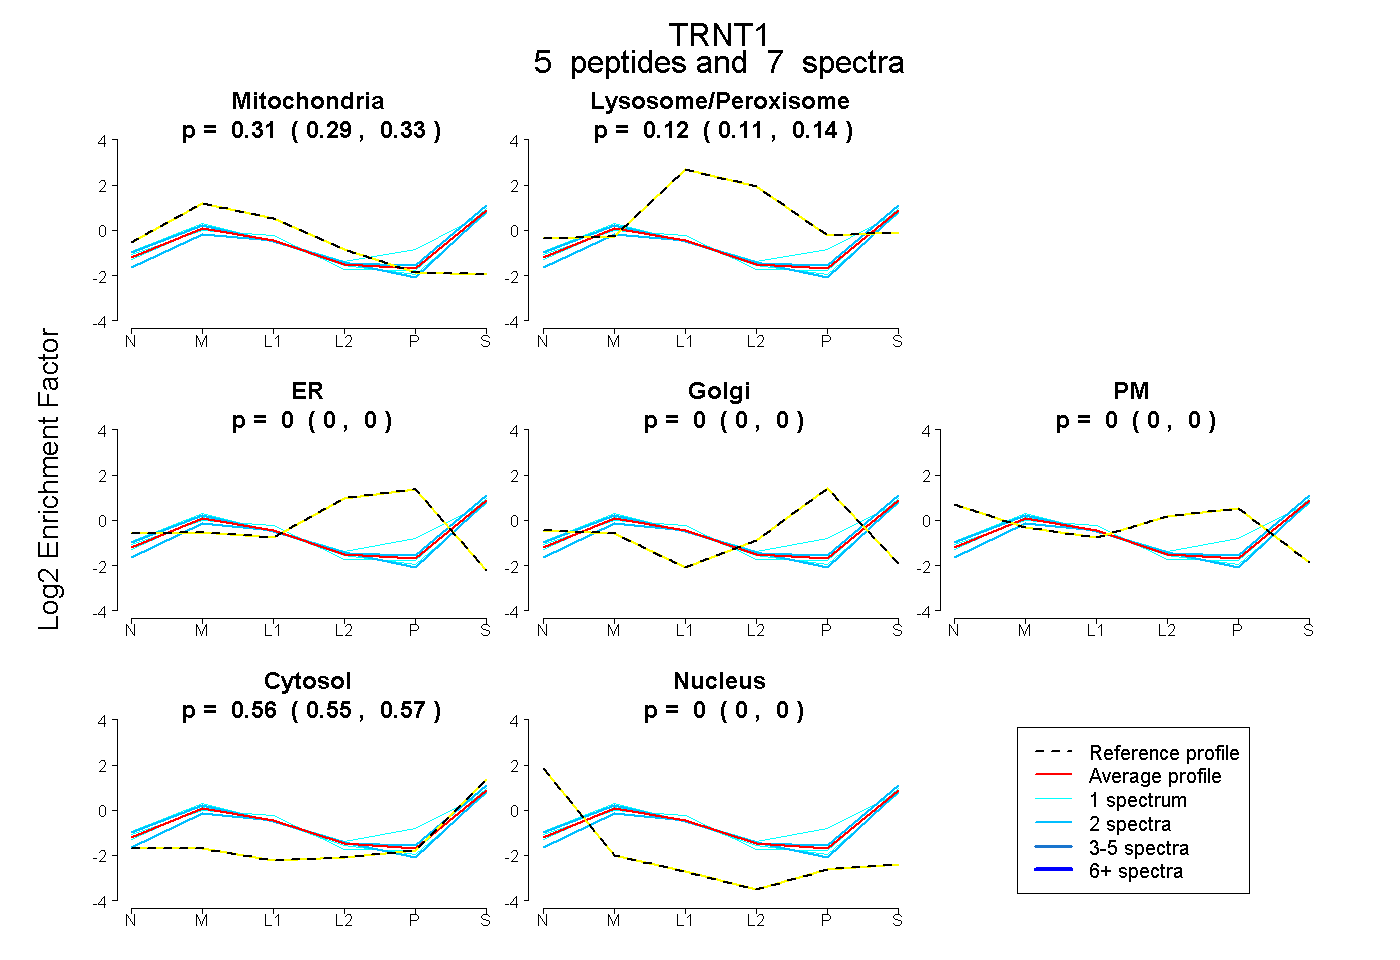 |
0.314
0.294 | 0.331 |
|
0.123
0.106 | 0.137 |
|
0.000
0.000 | 0.000 |
0.000
0.000 | 0.000 |
0.000
0.000 | 0.000 |
0.563
0.553 | 0.572 |
0.000
0.000 | 0.000 |
|
| 2 spectra, LHEENFEVTTLR |
0.207 |
|
0.166 |
|
0.000 |
0.000 |
0.000 |
0.627 |
0.000 |
|
| 1 spectrum, FVGHAK |
0.318 |
|
0.120 |
|
0.000 |
0.000 |
0.000 |
0.563 |
0.000 |
|
| 2 spectra, IDVSTDGR |
0.379 |
|
0.083 |
|
0.000 |
0.000 |
0.000 |
0.538 |
0.000 |
|
| 1 spectrum, GLAGISGER |
0.413 |
|
0.060 |
|
0.000 |
0.000 |
0.000 |
0.527 |
0.000 |
|
| 1 spectrum, EIGALLQQLR |
0.239 |
|
0.192 |
|
0.000 |
0.034 |
0.000 |
0.535 |
0.000 |
|
| | | Plot |
|
Lyso |
|
|
|
|
|
|
|
Other |
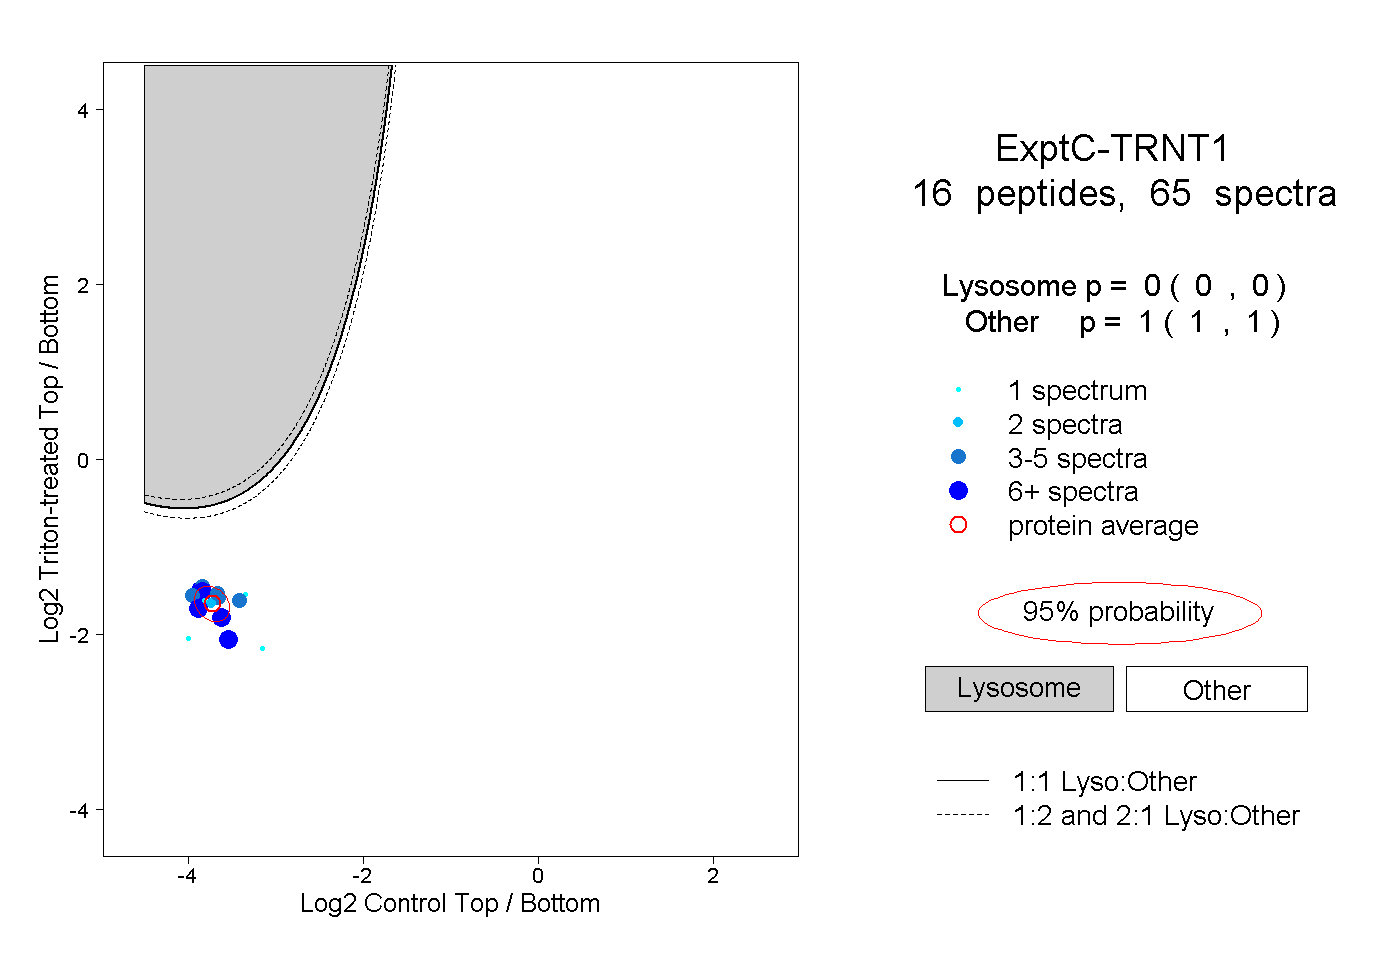
| Expt C |
16
peptides |
65
spectra |
 |
|
0.000
0.000 | 0.000 |
|
|
|
|
|
|
|
1.000
1.000 | 1.000 |
| | | Plot |
|
Lyso |
|
|
|
|
|
|
|
Other |
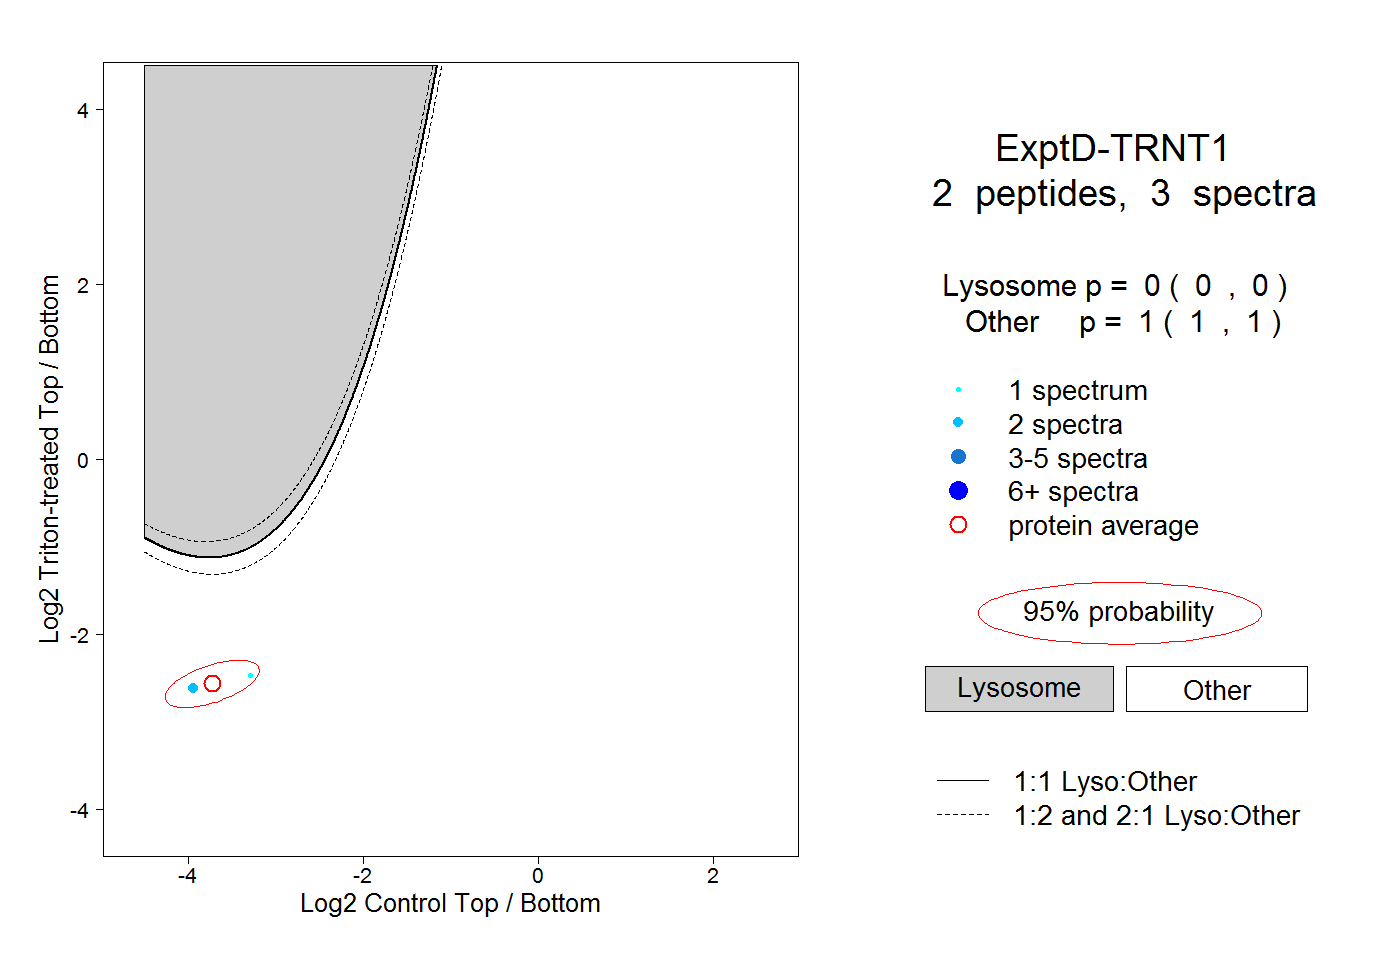
| Expt D |
2
peptides |
3
spectra |
 |
|
0.000
0.000 | 0.000 |
|
|
|
|
|
|
|
1.000
1.000 | 1.000 |