 7
7peptides
spectra
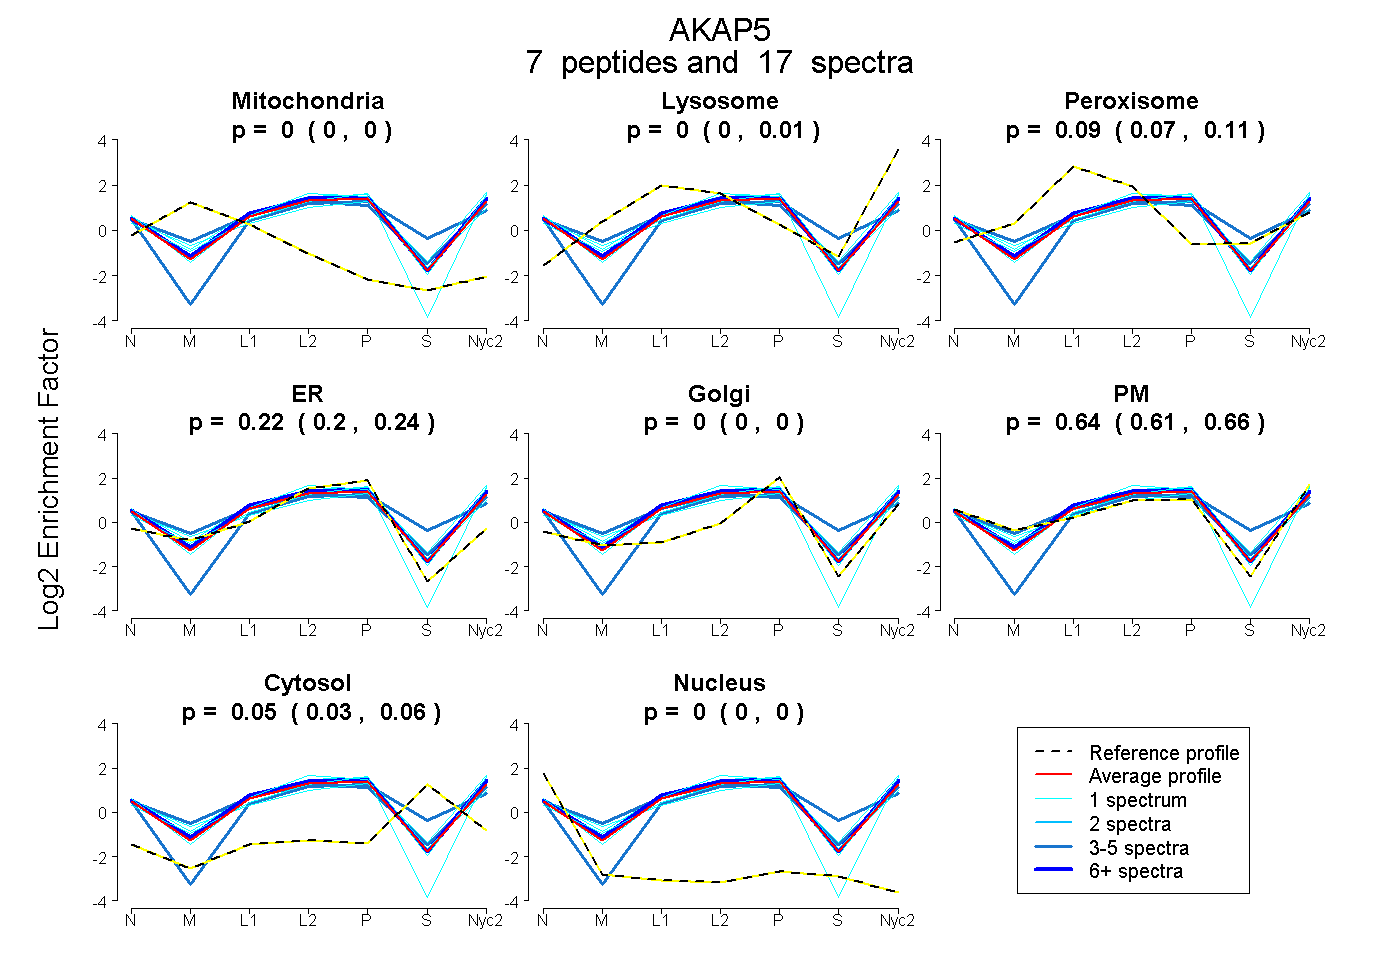
0.000 | 0.000
0.000 | 0.011
0.069 | 0.107
0.196 | 0.242
0.000 | 0.000
0.614 | 0.662
0.029 | 0.063
0.000 | 0.000
17peptides
spectra
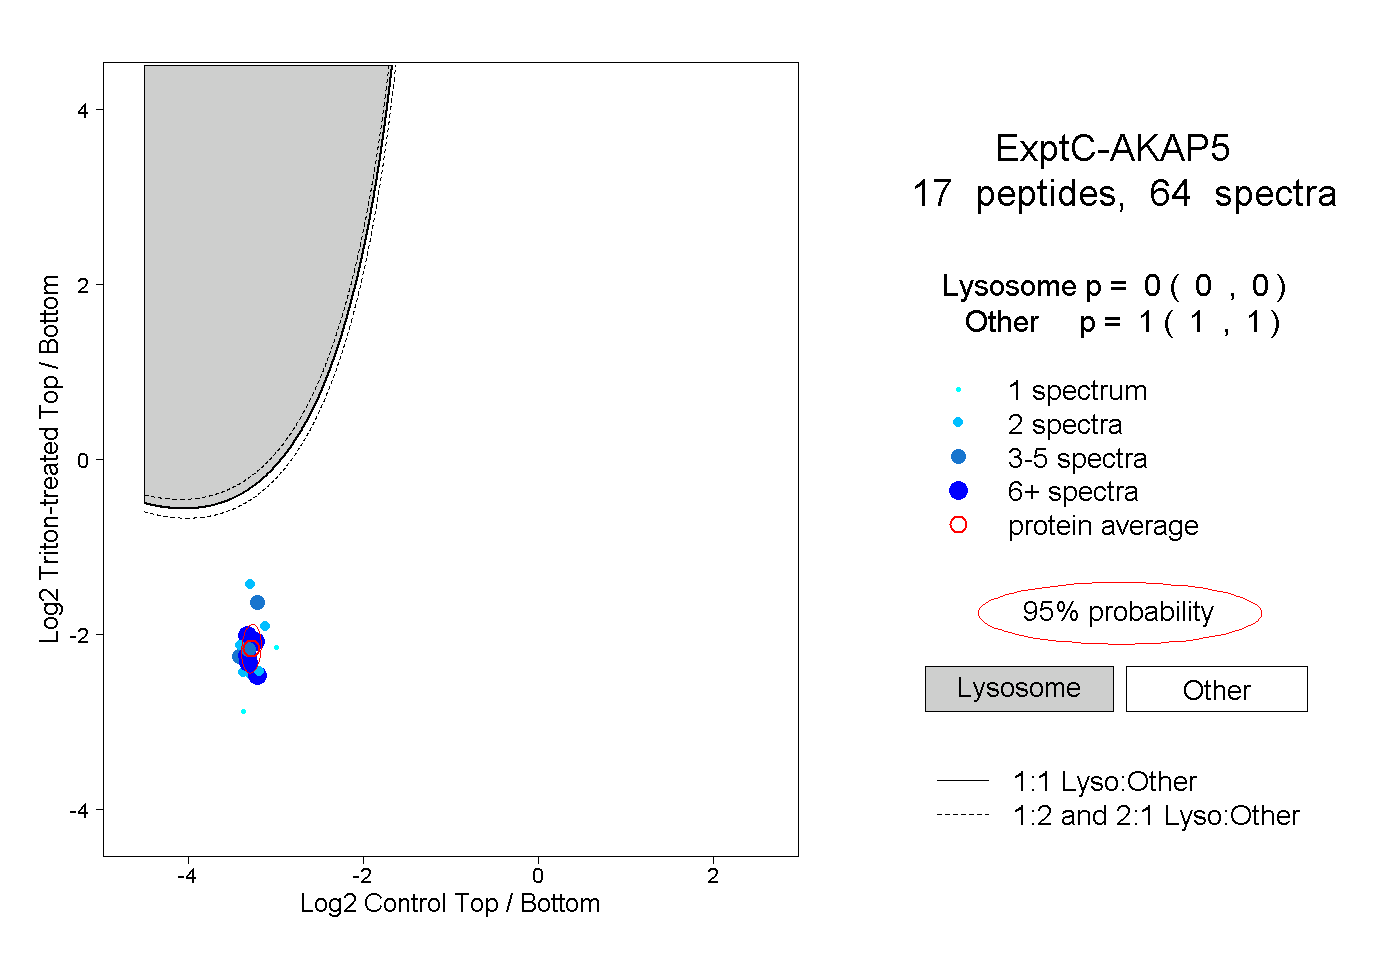
0.000 | 0.000
1.000 | 1.000
2peptides
spectra
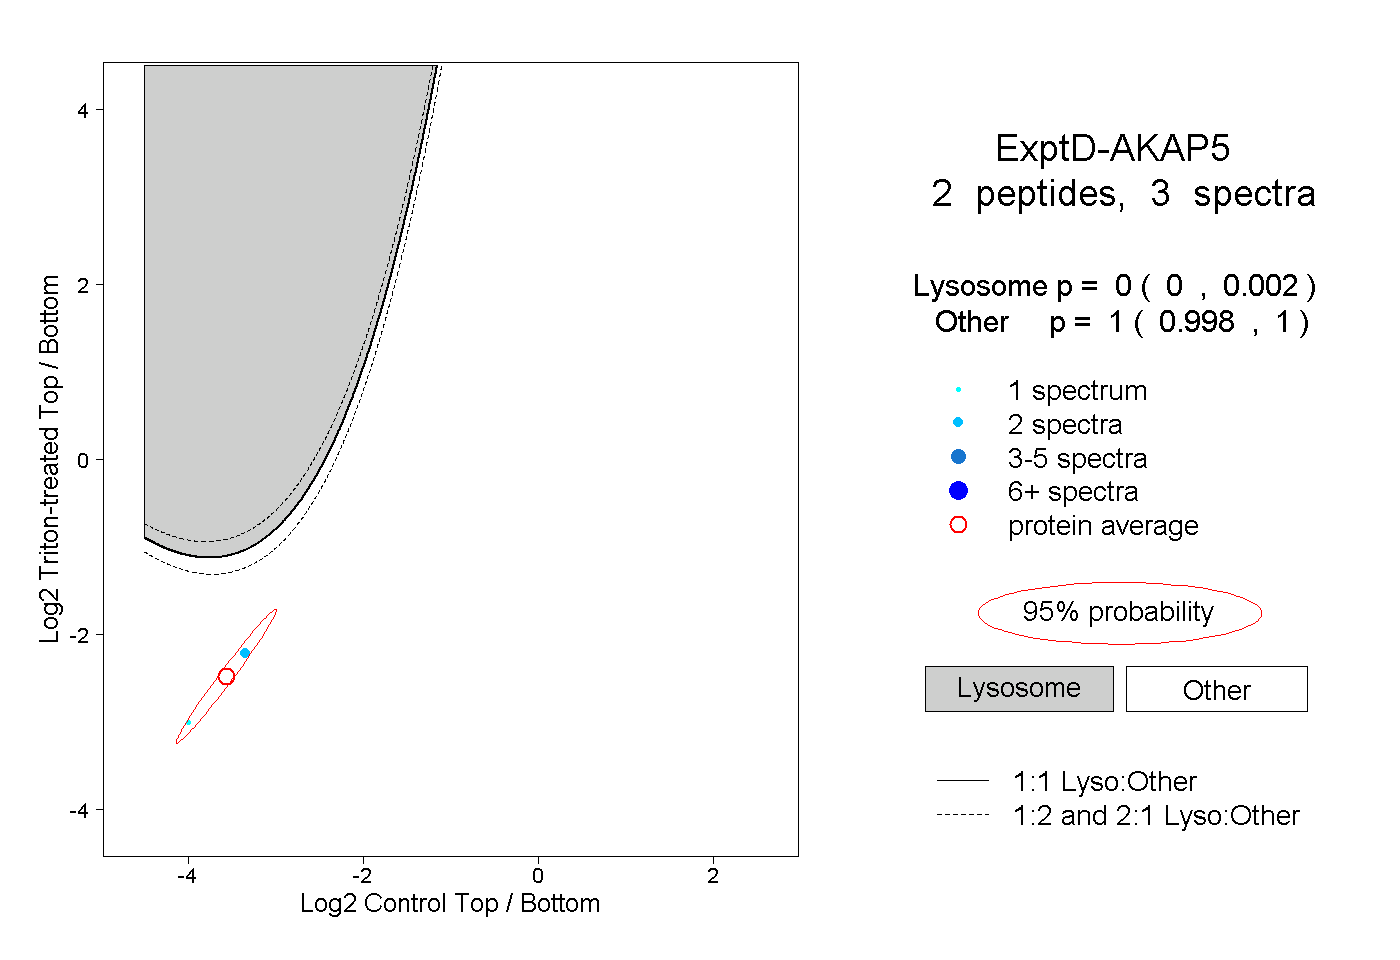
0.000 | 0.002
0.998 | 1.000