 7
7peptides
spectra
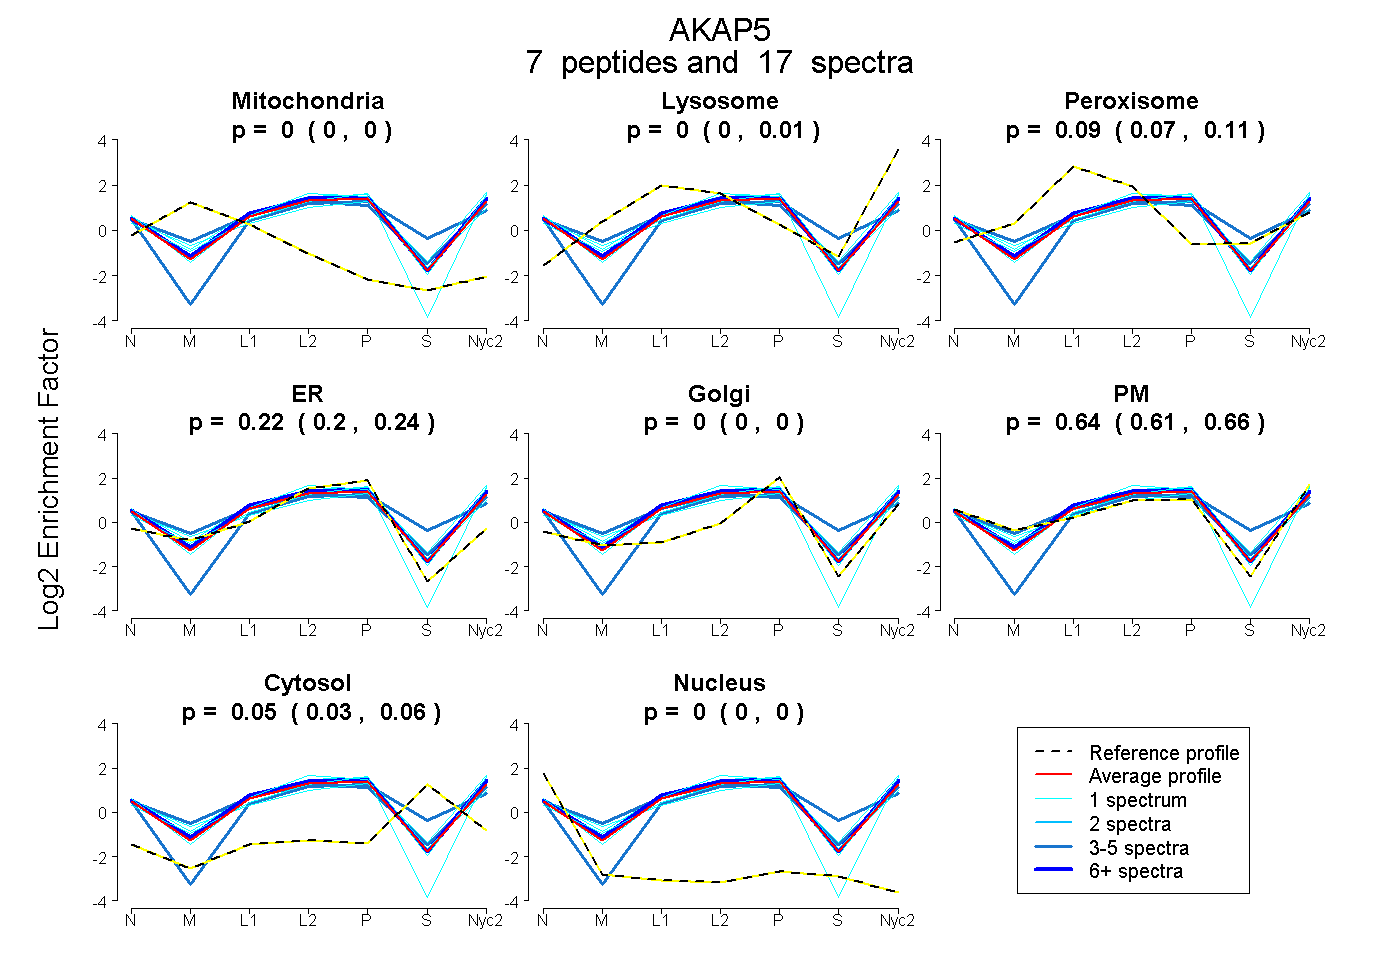
0.000 | 0.000
0.000 | 0.011
0.069 | 0.107
0.196 | 0.242
0.000 | 0.000
0.614 | 0.662
0.029 | 0.063
0.000 | 0.000
17peptides
spectra
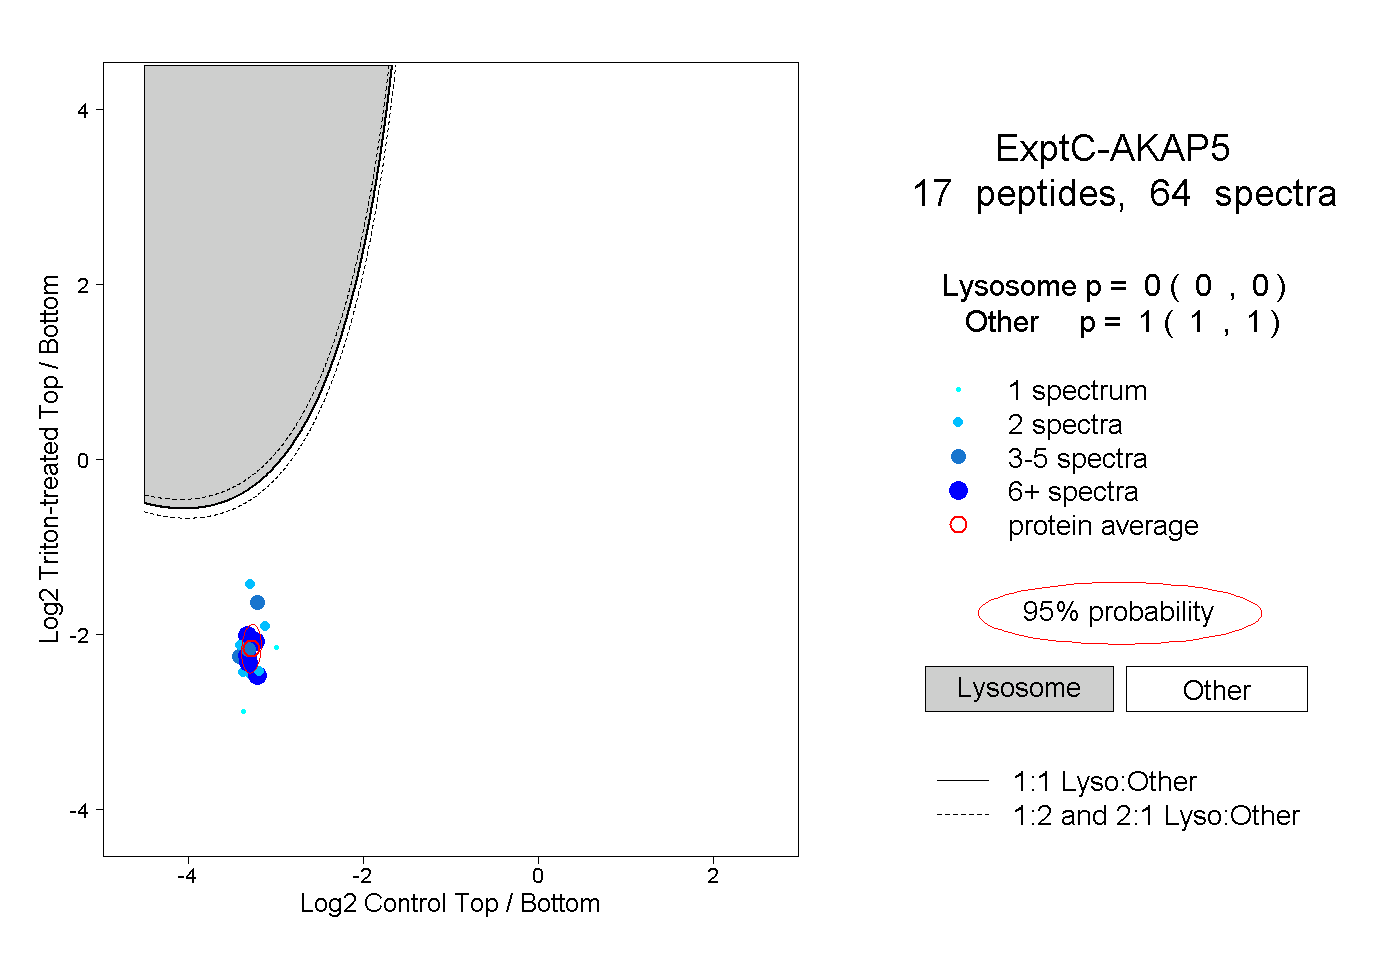
0.000 | 0.000
1.000 | 1.000
| Plot | Mito | Lyso | Perox | ER | Golgi | PM | Cytosol | Nucleus | |||||
| Expt A |
7 peptides |
17 spectra |
|
0.000 0.000 | 0.000 |
0.000 0.000 | 0.011 |
0.090 0.069 | 0.107 |
0.219 0.196 | 0.242 |
0.000 0.000 | 0.000 |
0.644 0.614 | 0.662 |
0.046 0.029 | 0.063 |
0.000 0.000 | 0.000 |
||
| Plot | Lyso | Other | |||||||||||
| Expt C |
17 peptides |
64 spectra |
|
0.000 0.000 | 0.000 |
1.000 1.000 | 1.000 |
| 3 spectra, VQGEADDLEIK | 0.000 | 1.000 | ||||||||
| 2 spectra, EAIVSQAEEAIVGHTEK | 0.000 | 1.000 | ||||||||
| 6 spectra, ESAPSGK | 0.000 | 1.000 | ||||||||
| 3 spectra, ATMGQAEEATVGHIEK | 0.000 | 1.000 | ||||||||
| 1 spectrum, HAPEAGGSGQR | 0.000 | 1.000 | ||||||||
| 10 spectra, KPSESAEK | 0.000 | 1.000 | ||||||||
| 1 spectrum, ATAEEK | 0.000 | 1.000 | ||||||||
| 7 spectra, RPEAASPQK | 0.000 | 1.000 | ||||||||
| 2 spectra, STQGLQEDVMVR | 0.000 | 1.000 | ||||||||
| 1 spectrum, LSQAEEATVAQAK | 0.000 | 1.000 | ||||||||
| 7 spectra, TPGSEK | 0.000 | 1.000 | ||||||||
| 4 spectra, TAAEEK | 0.000 | 1.000 | ||||||||
| 2 spectra, TATLCFK | 0.000 | 1.000 | ||||||||
| 9 spectra, LTEDSGYVR | 0.000 | 1.000 | ||||||||
| 2 spectra, AQIQPDEQATQAK | 0.000 | 1.000 | ||||||||
| 2 spectra, VNGVDAEKPR | 0.000 | 1.000 | ||||||||
| 2 spectra, ATVGQAK | 0.000 | 1.000 |
| Plot | Lyso | Other | |||||||||||
| Expt D |
2 peptides |
3 spectra |
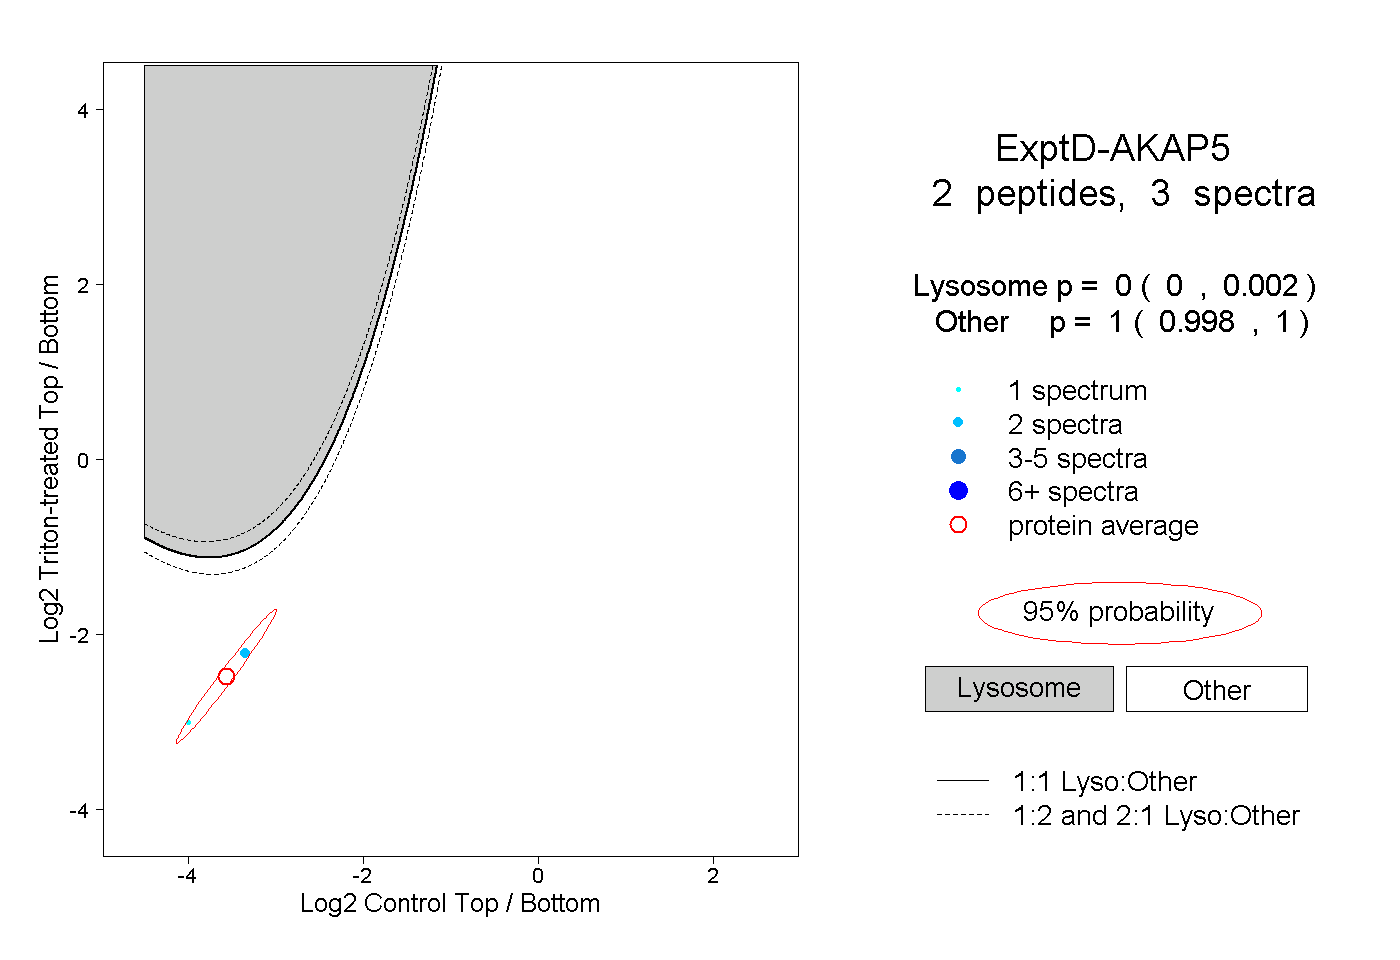 |
0.000 0.000 | 0.002 |
1.000 0.998 | 1.000 |