 7
7peptides
spectra
0.000 | 0.000
0.000 | 0.011
0.069 | 0.107
0.196 | 0.242
0.000 | 0.000
0.614 | 0.662
0.029 | 0.063
0.000 | 0.000
| Plot | Mito | Lyso | Perox | ER | Golgi | PM | Cytosol | Nucleus | |||||
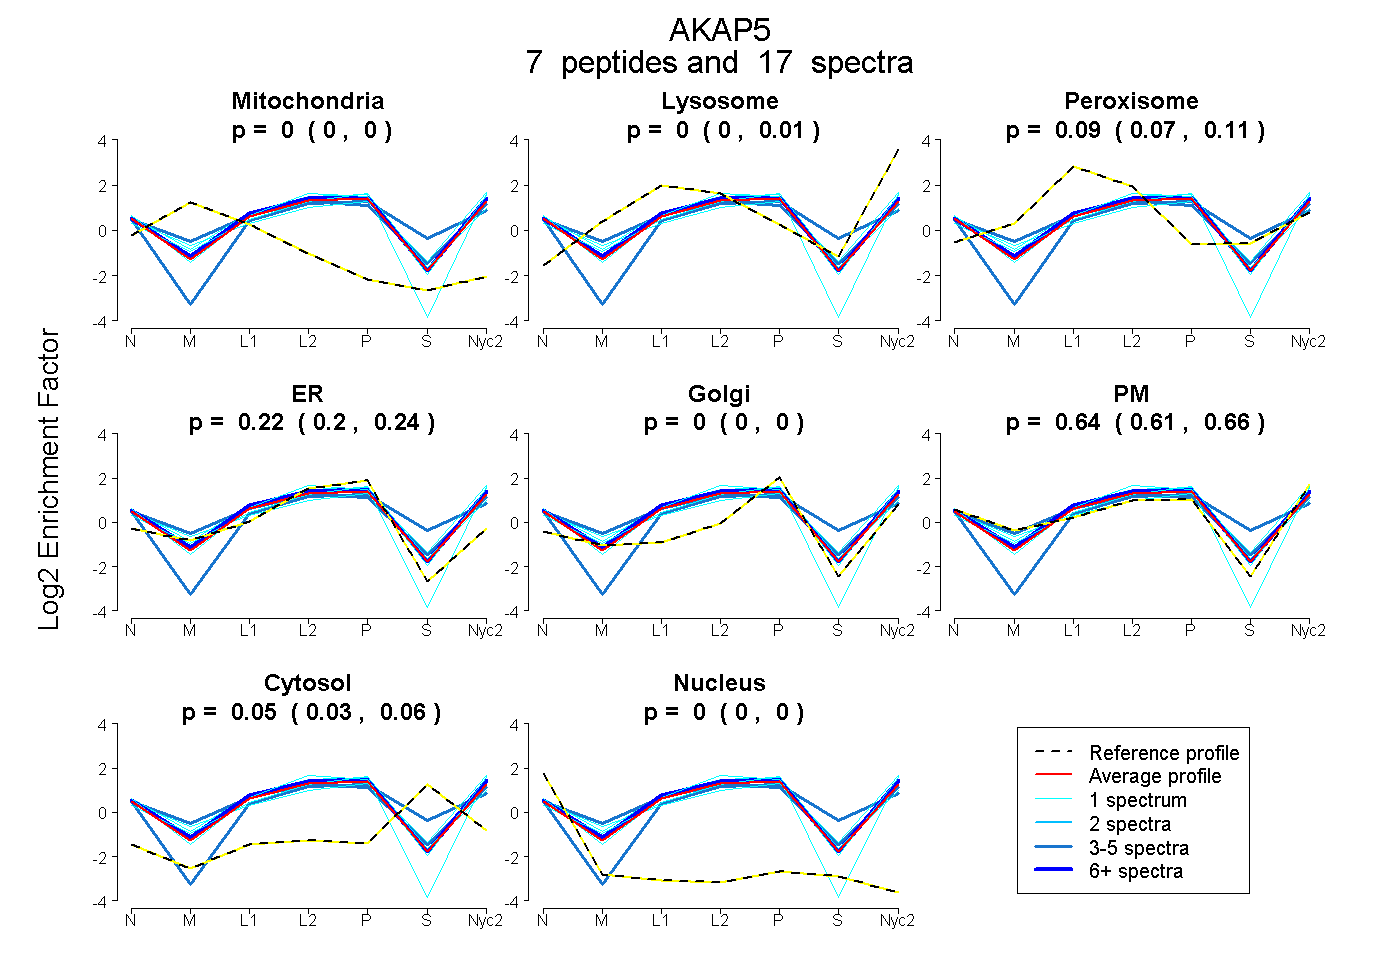
| Expt A |
7 peptides |
17 spectra |
|
0.000 0.000 | 0.000 |
0.000 0.000 | 0.011 |
0.090 0.069 | 0.107 |
0.219 0.196 | 0.242 |
0.000 0.000 | 0.000 |
0.644 0.614 | 0.662 |
0.046 0.029 | 0.063 |
0.000 0.000 | 0.000 |
| 6 spectra, STQGLQEDVMVR | 0.000 | 0.022 | 0.107 | 0.204 | 0.000 | 0.652 | 0.014 | 0.000 | ||
| 1 spectrum, VQGEADDLEIK | 0.000 | 0.028 | 0.059 | 0.221 | 0.000 | 0.692 | 0.000 | 0.000 | ||
| 1 spectrum, TPGSEK | 0.000 | 0.014 | 0.100 | 0.326 | 0.065 | 0.454 | 0.042 | 0.000 | ||
| 3 spectra, LSQAEEATVAQAK | 0.000 | 0.000 | 0.033 | 0.269 | 0.000 | 0.379 | 0.319 | 0.000 | ||
| 1 spectrum, LTEDSGYVR | 0.000 | 0.000 | 0.000 | 0.220 | 0.000 | 0.780 | 0.000 | 0.000 | ||
| 4 spectra, HAPEAGGSGQR | 0.000 | 0.000 | 0.199 | 0.147 | 0.000 | 0.610 | 0.045 | 0.000 | ||
| 1 spectrum, RPEAASPQK | 0.000 | 0.083 | 0.043 | 0.000 | 0.058 | 0.735 | 0.080 | 0.000 |
| Plot | Lyso | Other | |||||||||||
| Expt C |
17 peptides |
64 spectra |
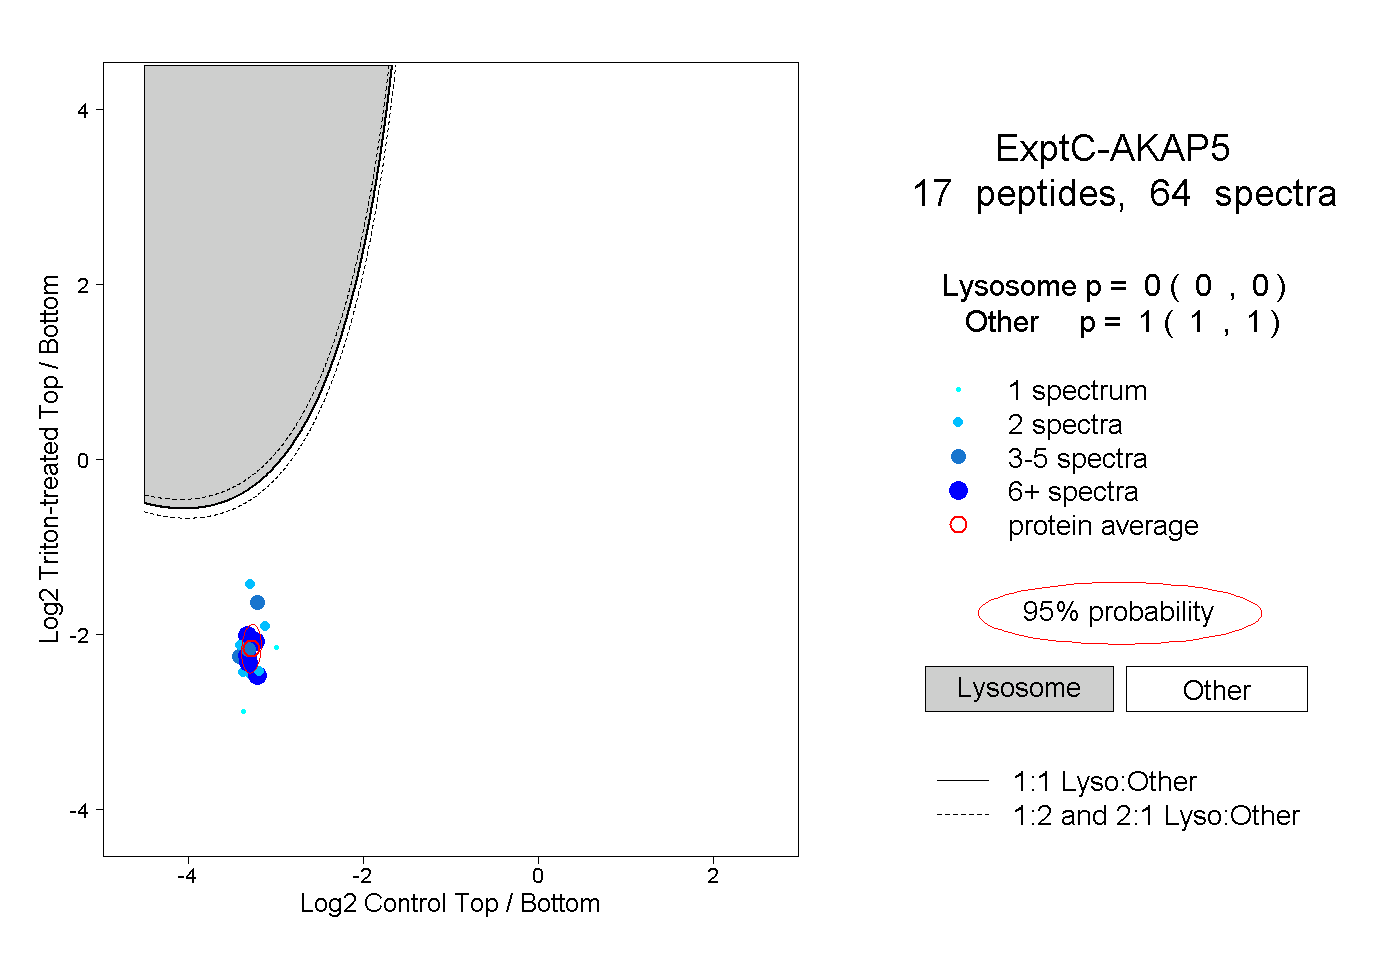 |
0.000 0.000 | 0.000 |
1.000 1.000 | 1.000 |
||||||||
| Plot | Lyso | Other | |||||||||||
| Expt D |
2 peptides |
3 spectra |
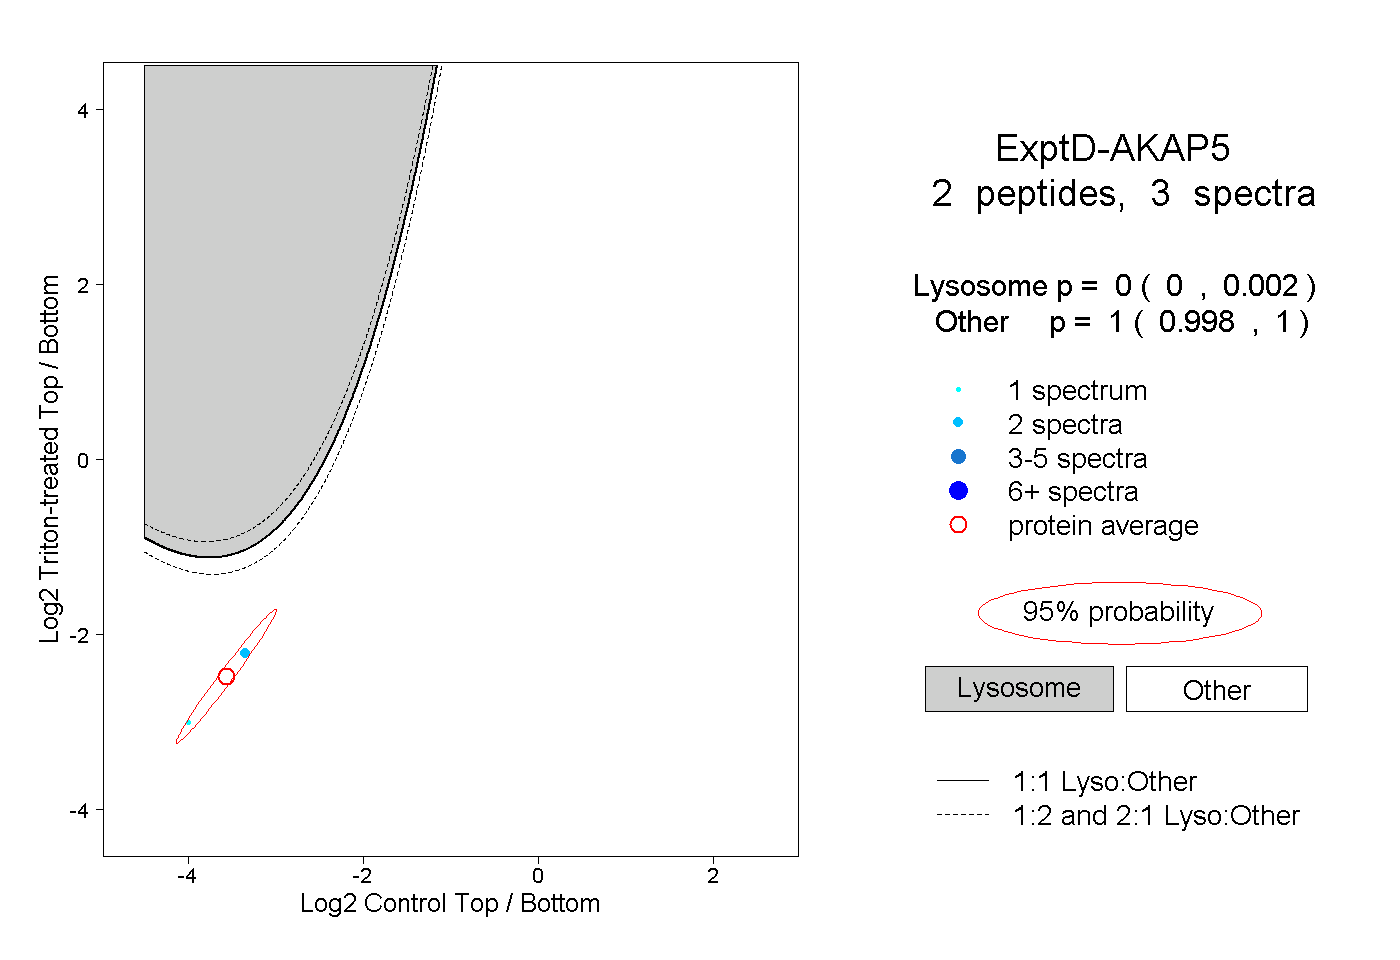 |
0.000 0.000 | 0.002 |
1.000 0.998 | 1.000 |