 15
15peptides
spectra
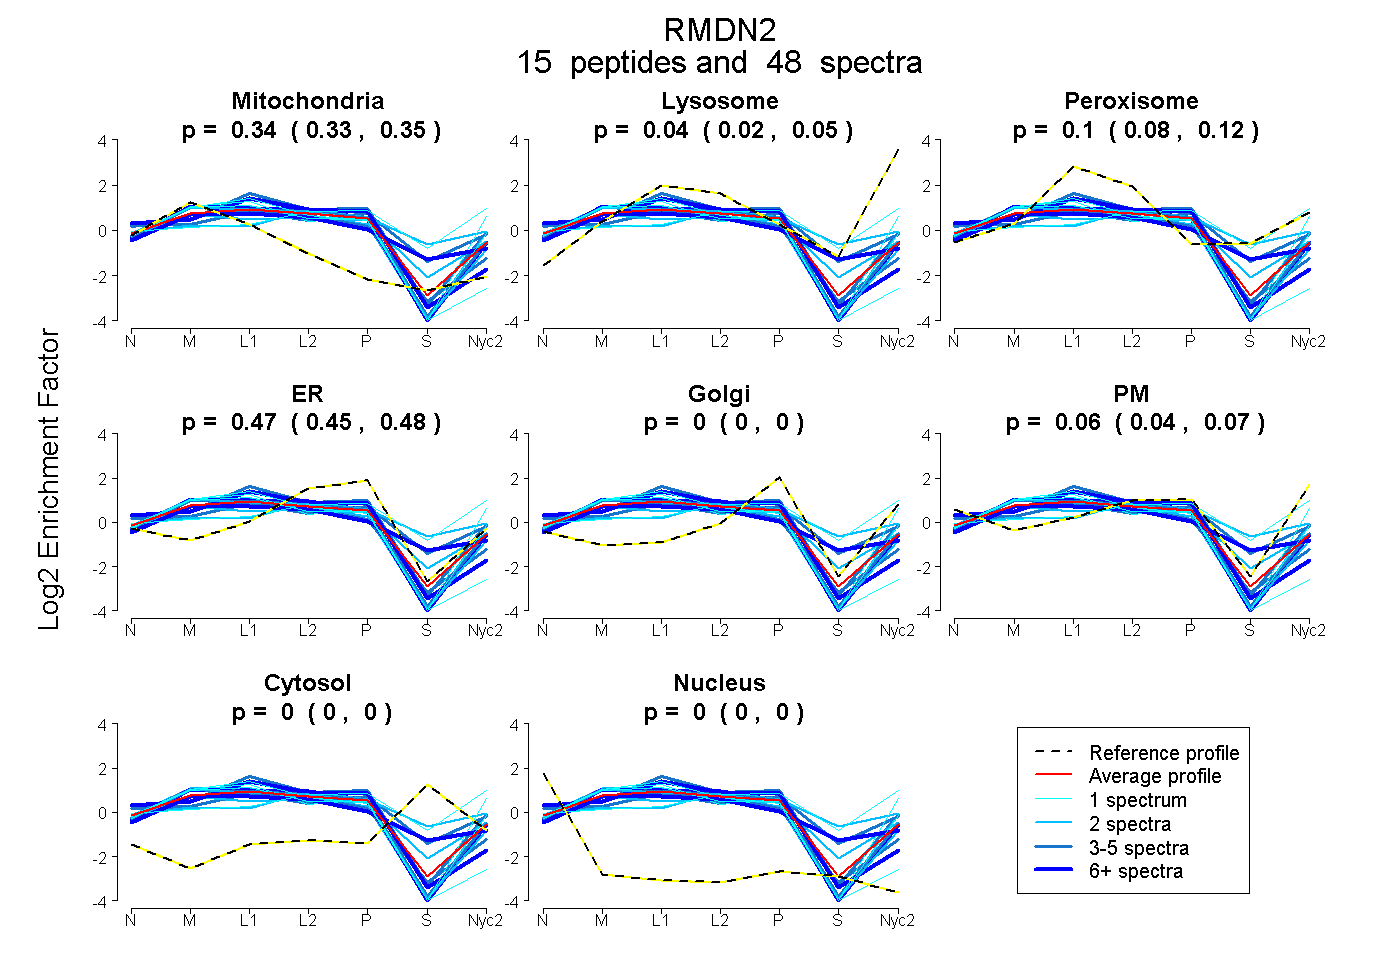
0.331 | 0.346
0.022 | 0.047
0.079 | 0.116
0.450 | 0.479
0.000 | 0.000
0.045 | 0.074
0.000 | 0.000
0.000 | 0.000
10peptides
spectra
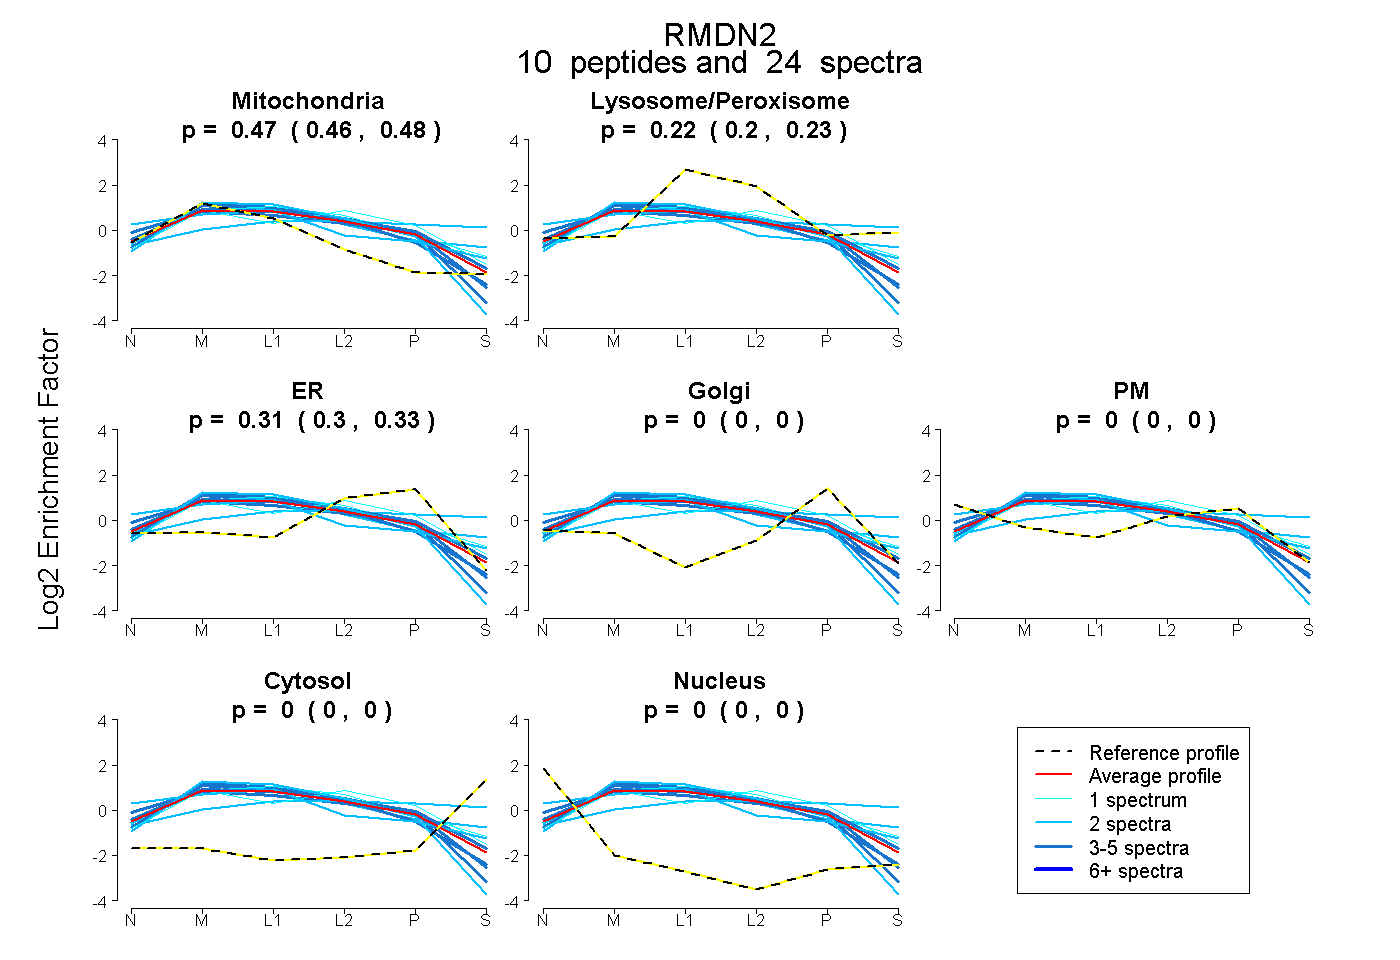
0.459 | 0.481
0.196 | 0.232
0.299 | 0.325
0.000 | 0.000
0.000 | 0.000
0.000 | 0.000
0.000 | 0.000
13peptides
spectra
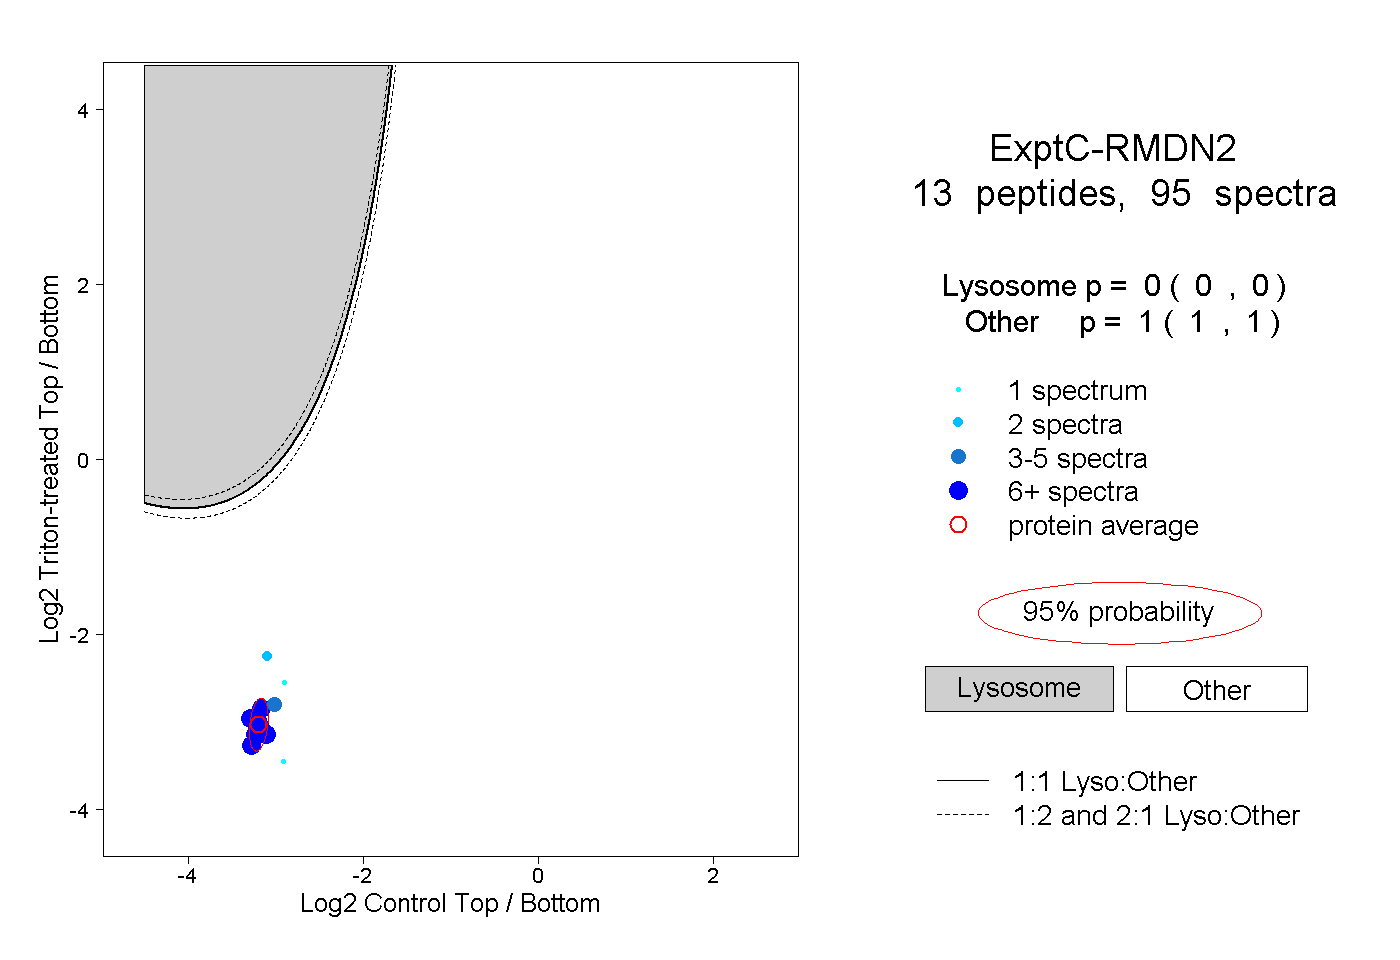
0.000 | 0.000
1.000 | 1.000
8peptides
spectra
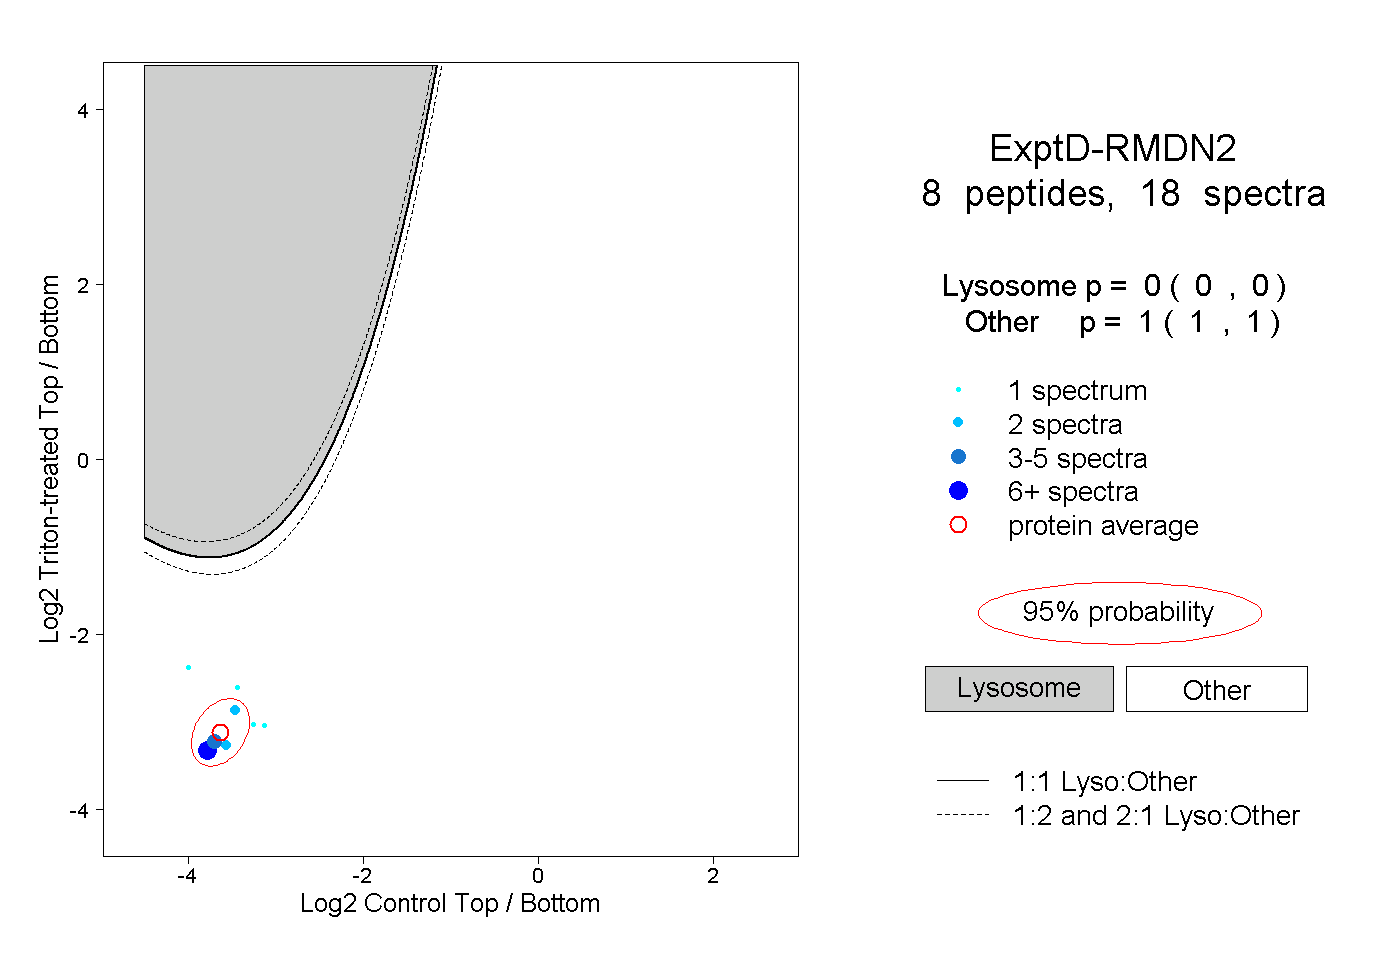
0.000 | 0.000
1.000 | 1.000