 15
15peptides
spectra
0.331 | 0.346
0.022 | 0.047
0.079 | 0.116
0.450 | 0.479
0.000 | 0.000
0.045 | 0.074
0.000 | 0.000
0.000 | 0.000
| Plot | Mito | Lyso | Perox | ER | Golgi | PM | Cytosol | Nucleus | |||||
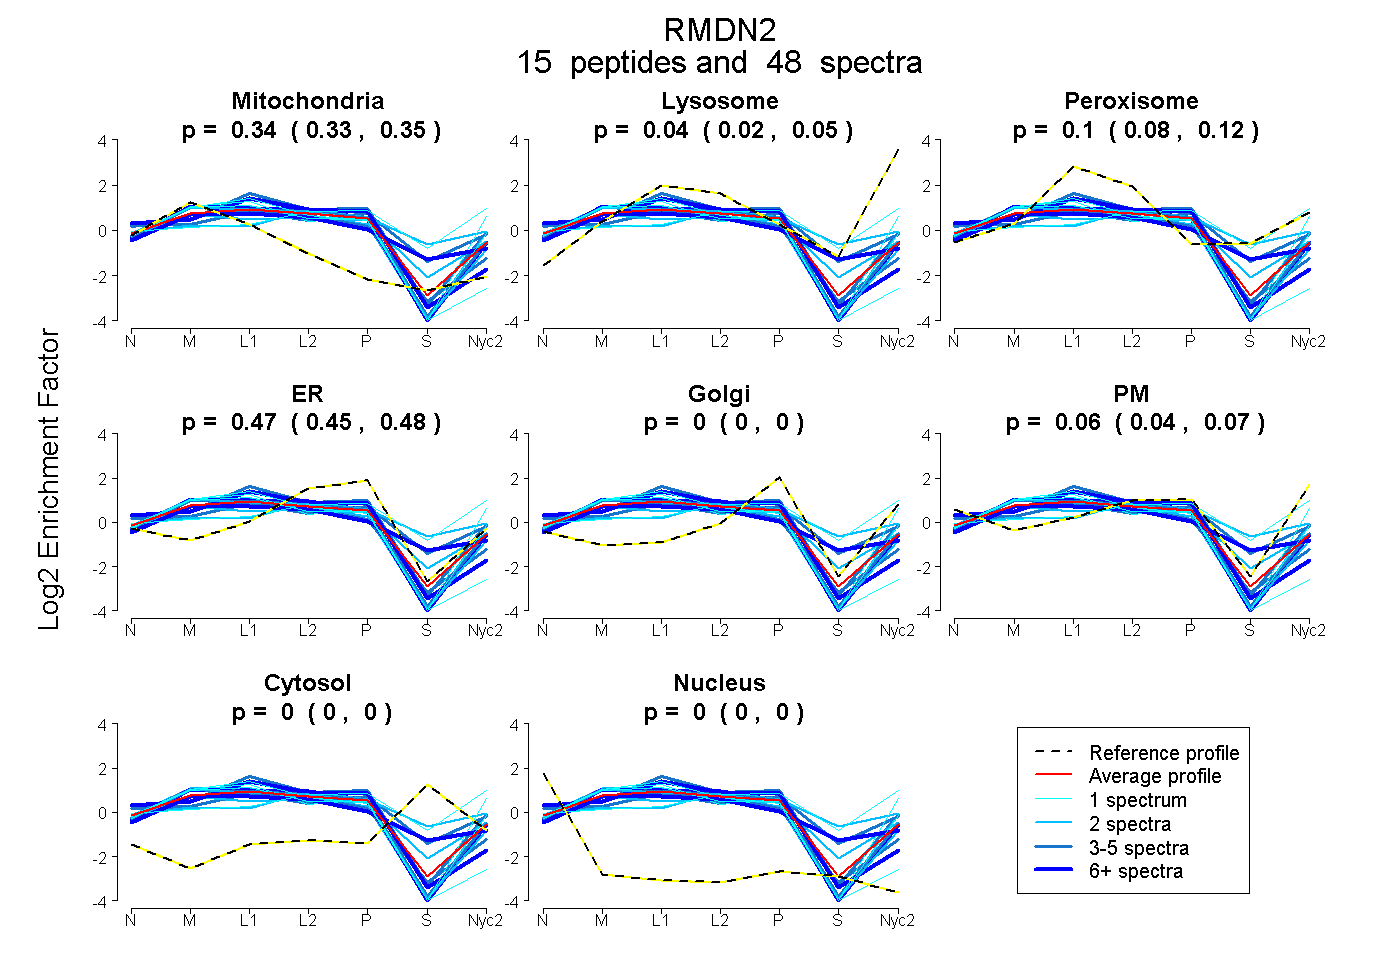
| Expt A |
15 peptides |
48 spectra |
|
0.339 0.331 | 0.346 |
0.035 0.022 | 0.047 |
0.099 0.079 | 0.116 |
0.466 0.450 | 0.479 |
0.000 0.000 | 0.000 |
0.061 0.045 | 0.074 |
0.000 0.000 | 0.000 |
0.000 0.000 | 0.000 |
| 2 spectra, IIGSLK | 0.346 | 0.044 | 0.114 | 0.393 | 0.026 | 0.077 | 0.000 | 0.000 | ||
| 1 spectrum, YCYTVSK | 0.535 | 0.000 | 0.000 | 0.465 | 0.000 | 0.000 | 0.000 | 0.000 | ||
| 1 spectrum, TEELQPGYSVSNYMYVAK | 0.375 | 0.118 | 0.000 | 0.353 | 0.000 | 0.154 | 0.000 | 0.000 | ||
| 4 spectra, CYVDLGESR | 0.472 | 0.000 | 0.065 | 0.463 | 0.000 | 0.000 | 0.000 | 0.000 | ||
| 4 spectra, GQLQILEK | 0.196 | 0.000 | 0.342 | 0.147 | 0.312 | 0.000 | 0.000 | 0.002 | ||
| 6 spectra, LEECIQDELGVR | 0.367 | 0.000 | 0.025 | 0.608 | 0.000 | 0.000 | 0.000 | 0.000 | ||
| 9 spectra, MESFELLCDHK | 0.331 | 0.000 | 0.298 | 0.309 | 0.000 | 0.000 | 0.062 | 0.000 | ||
| 1 spectrum, VTVHQVSPQHR | 0.000 | 0.036 | 0.296 | 0.000 | 0.245 | 0.313 | 0.110 | 0.000 | ||
| 6 spectra, FSEEIEFLWR | 0.374 | 0.083 | 0.000 | 0.542 | 0.000 | 0.000 | 0.000 | 0.000 | ||
| 2 spectra, LNEAHK | 0.412 | 0.040 | 0.000 | 0.548 | 0.000 | 0.000 | 0.000 | 0.000 | ||
| 2 spectra, AYGDMYDLSTNTQEK | 0.392 | 0.085 | 0.000 | 0.298 | 0.000 | 0.225 | 0.000 | 0.000 | ||
| 3 spectra, INCGHLFK | 0.380 | 0.086 | 0.000 | 0.514 | 0.000 | 0.020 | 0.000 | 0.000 | ||
| 4 spectra, ALNTHIEDLK | 0.189 | 0.000 | 0.172 | 0.426 | 0.000 | 0.214 | 0.000 | 0.000 | ||
| 2 spectra, HYANVGK | 0.074 | 0.000 | 0.297 | 0.273 | 0.059 | 0.124 | 0.174 | 0.000 | ||
| 1 spectrum, MAATLFGEIPSSTVHEALHNFLK | 0.315 | 0.145 | 0.000 | 0.163 | 0.000 | 0.377 | 0.000 | 0.000 |
| Plot | Mito | Lyso or Perox | ER | Golgi | PM | Cytosol | Nucleus | ||||||
| Expt B |
10 peptides |
24 spectra |
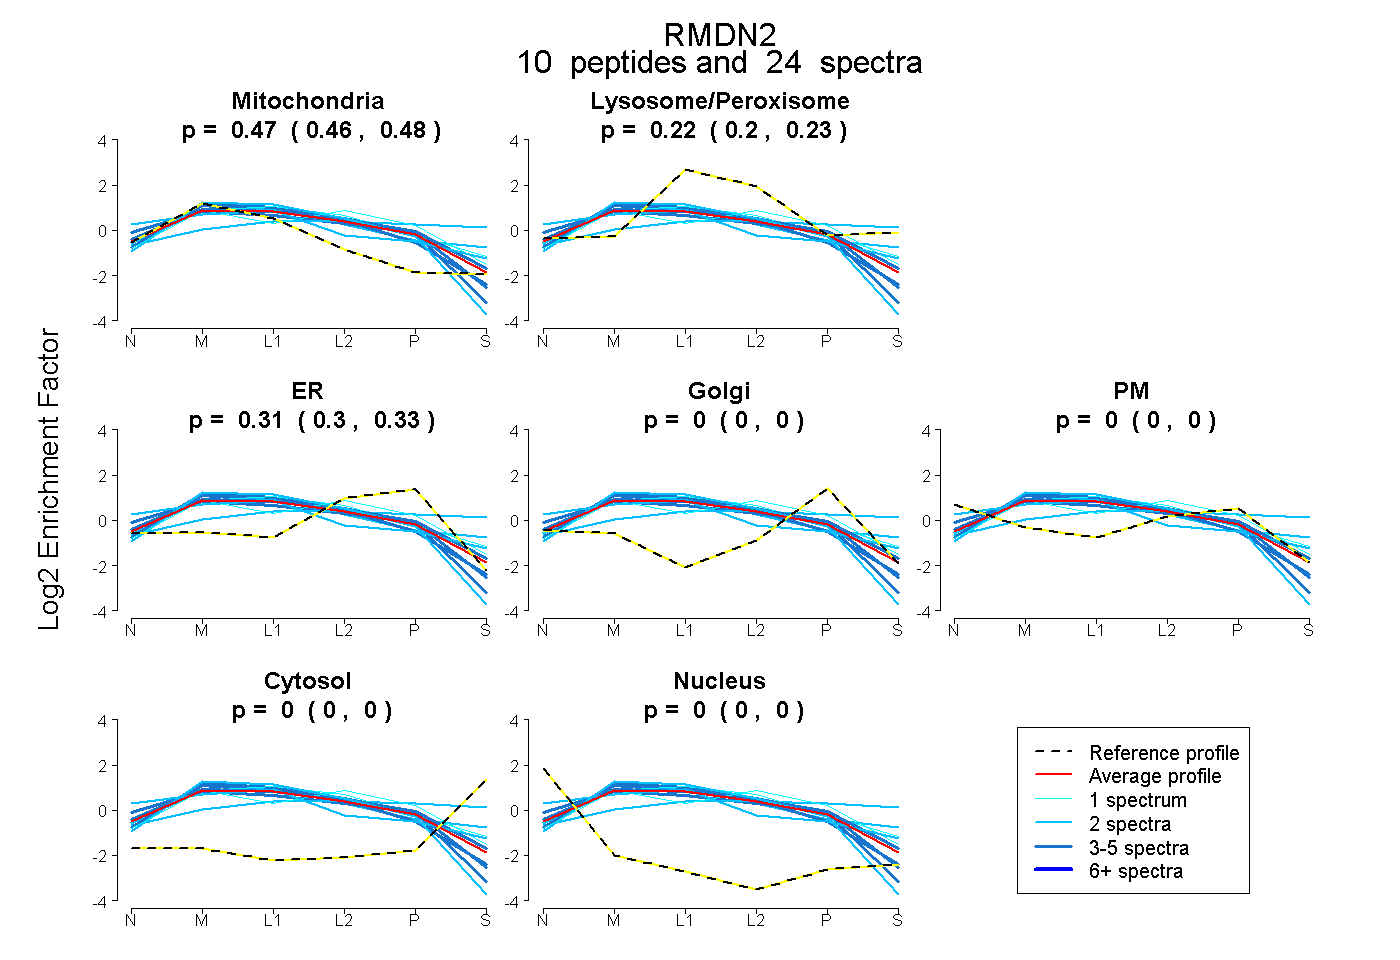 |
0.471 0.459 | 0.481 |
0.215 0.196 | 0.232 |
0.313 0.299 | 0.325 |
0.000 0.000 | 0.000 |
0.000 0.000 | 0.000 |
0.000 0.000 | 0.000 |
0.000 0.000 | 0.000 |
|||
| Plot | Lyso | Other | |||||||||||
| Expt C |
13 peptides |
95 spectra |
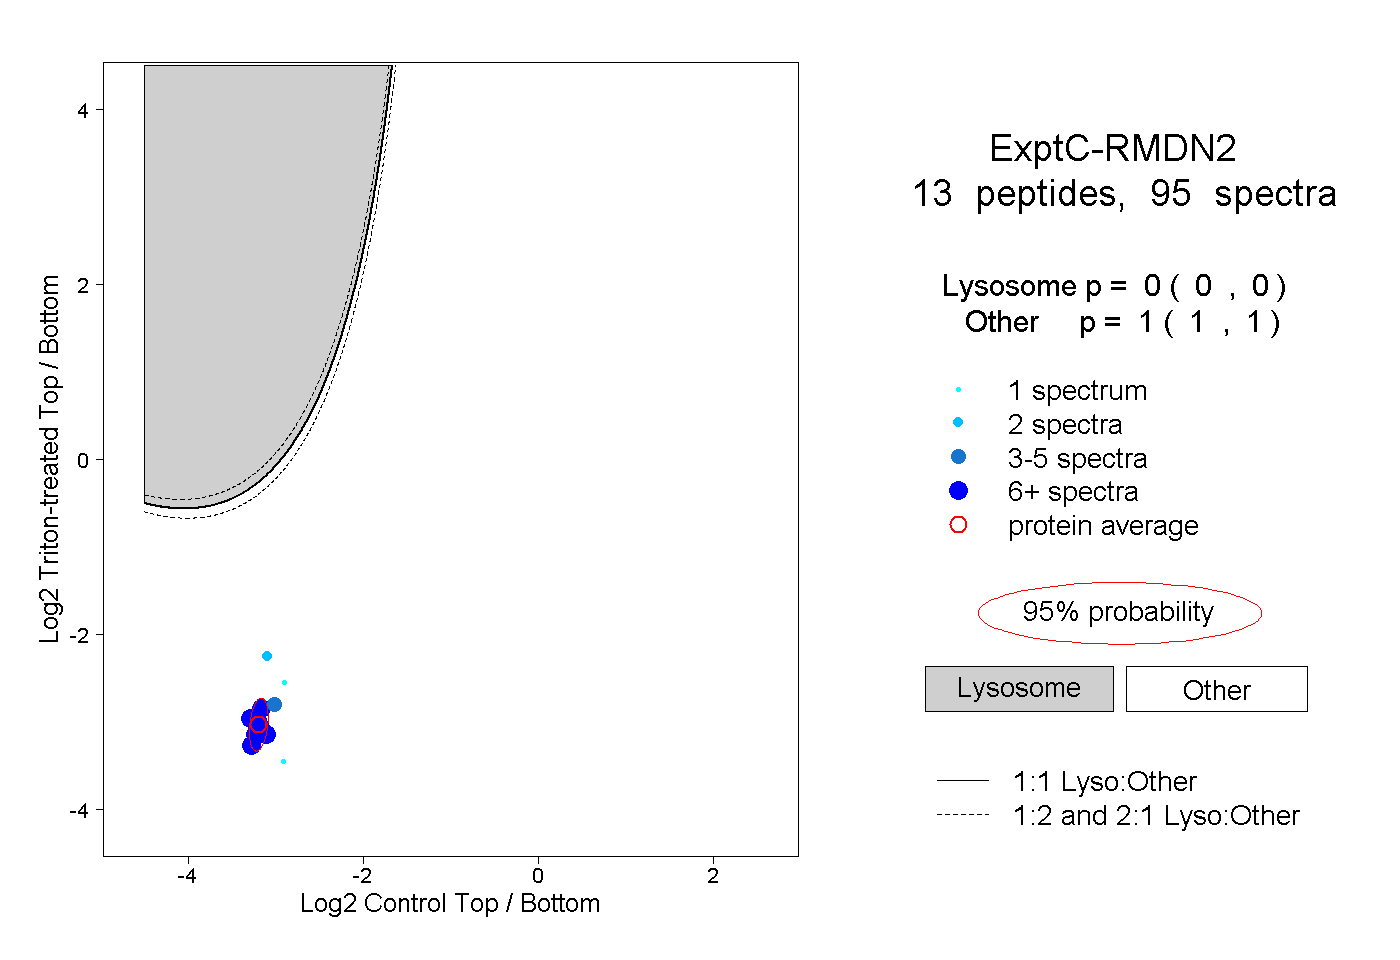 |
0.000 0.000 | 0.000 |
1.000 1.000 | 1.000 |
||||||||
| Plot | Lyso | Other | |||||||||||
| Expt D |
8 peptides |
18 spectra |
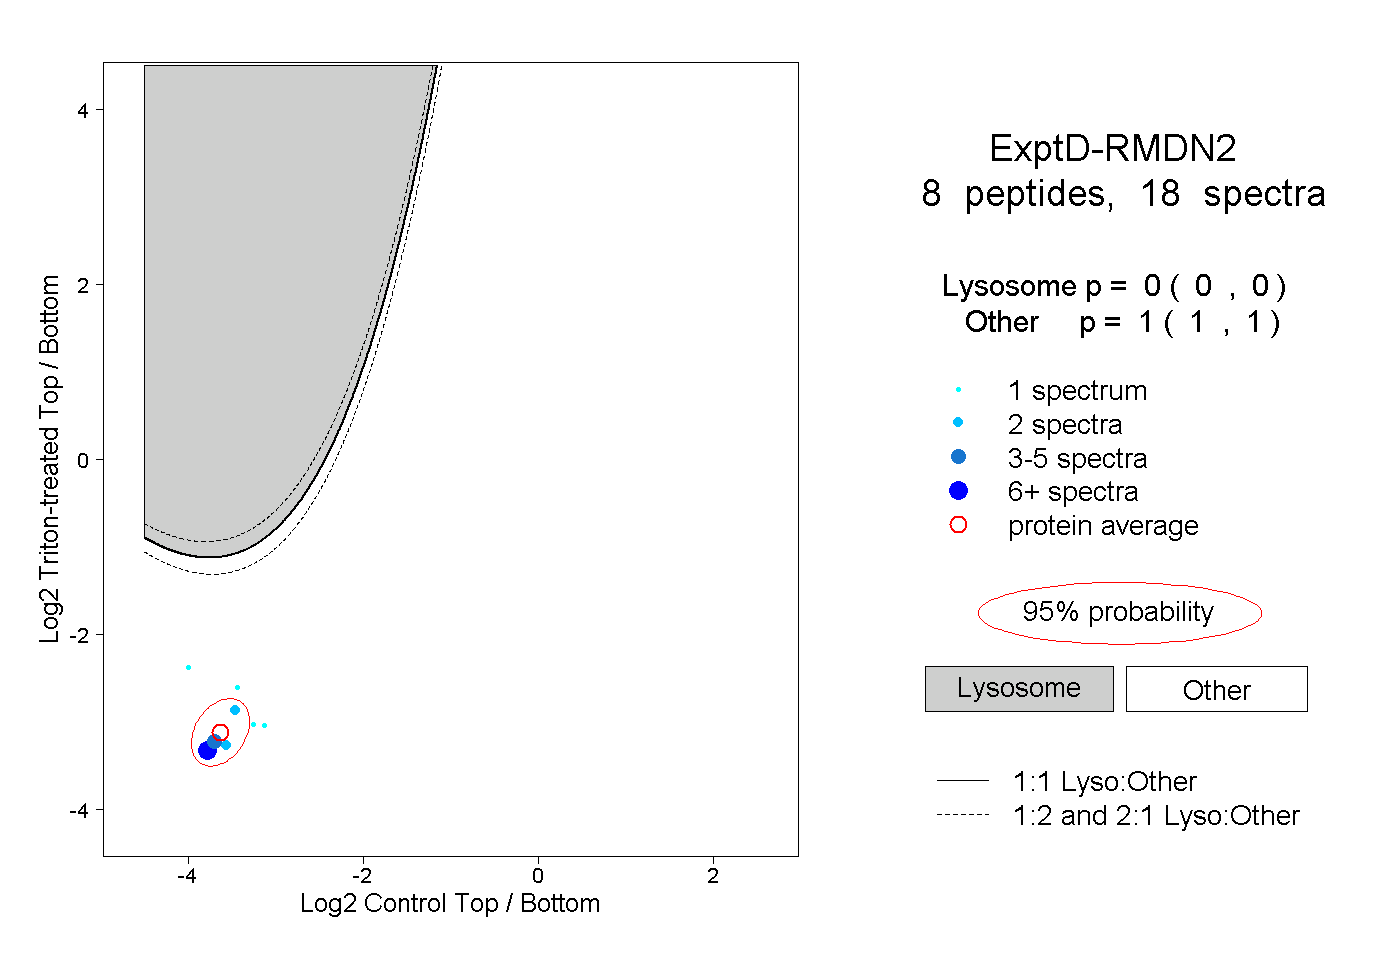 |
0.000 0.000 | 0.000 |
1.000 1.000 | 1.000 |