RMDN2
[ENSRNOP00000008045]
Main page
| | | Plot |
Mito |
Lyso |
|
Perox |
ER |
Golgi |
PM |
Cytosol |
Nucleus |
|
| Expt A |
 15
15
peptides |
48
spectra |
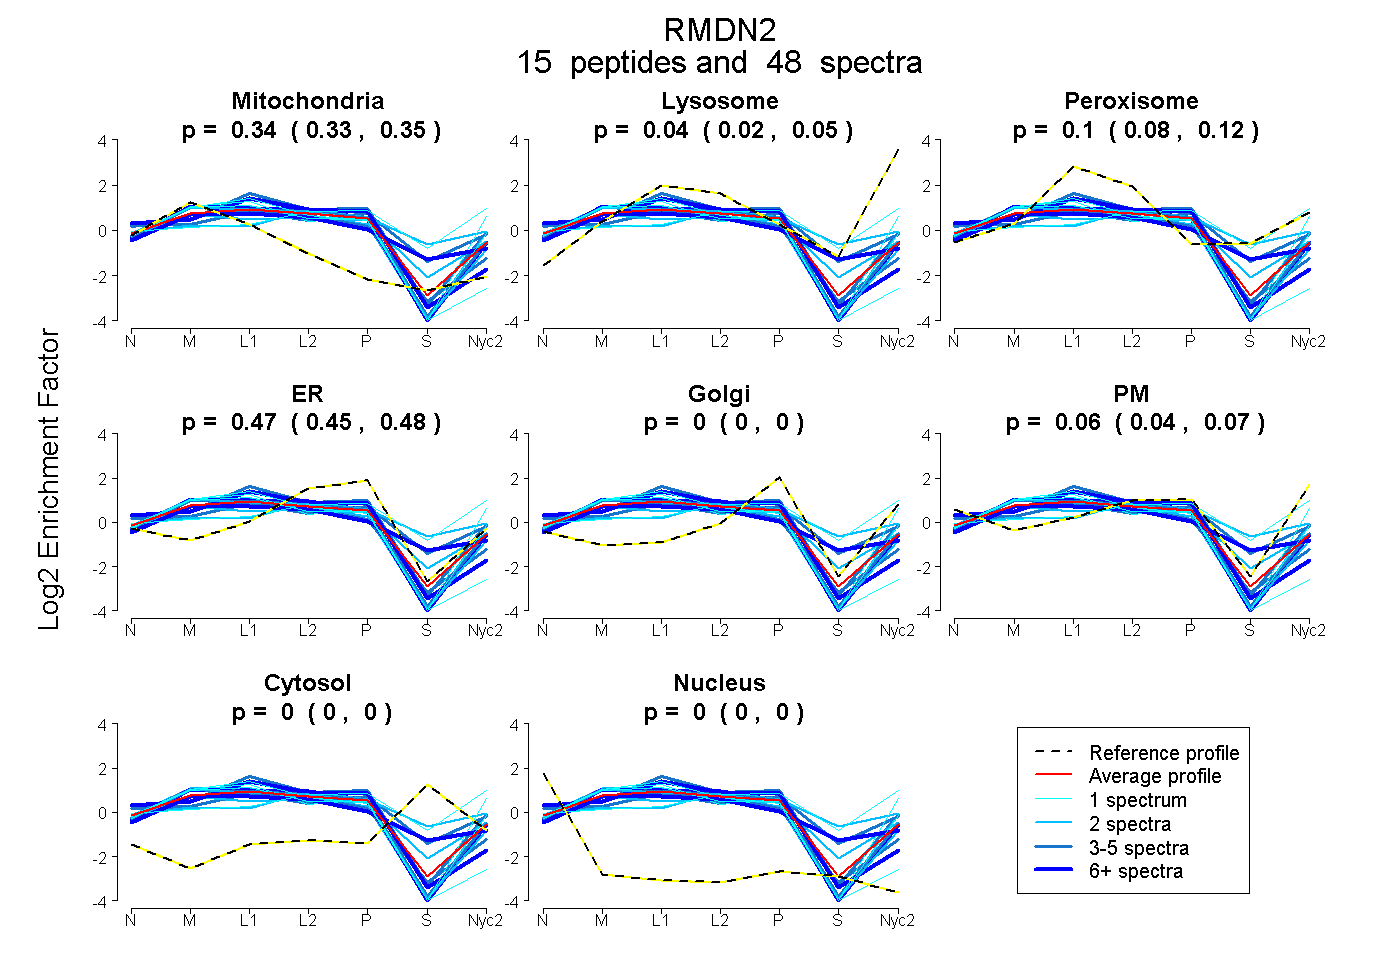 |
0.339
0.331 | 0.346 |
0.035
0.022 | 0.047 |
|
0.099
0.079 | 0.116 |
0.466
0.450 | 0.479 |
0.000
0.000 | 0.000 |
0.061
0.045 | 0.074 |
0.000
0.000 | 0.000 |
0.000
0.000 | 0.000 |
|
| | | Plot |
Mito |
|
Lyso or Perox |
|
ER |
Golgi |
PM |
Cytosol |
Nucleus |
|
| Expt B |
10
peptides |
24
spectra |
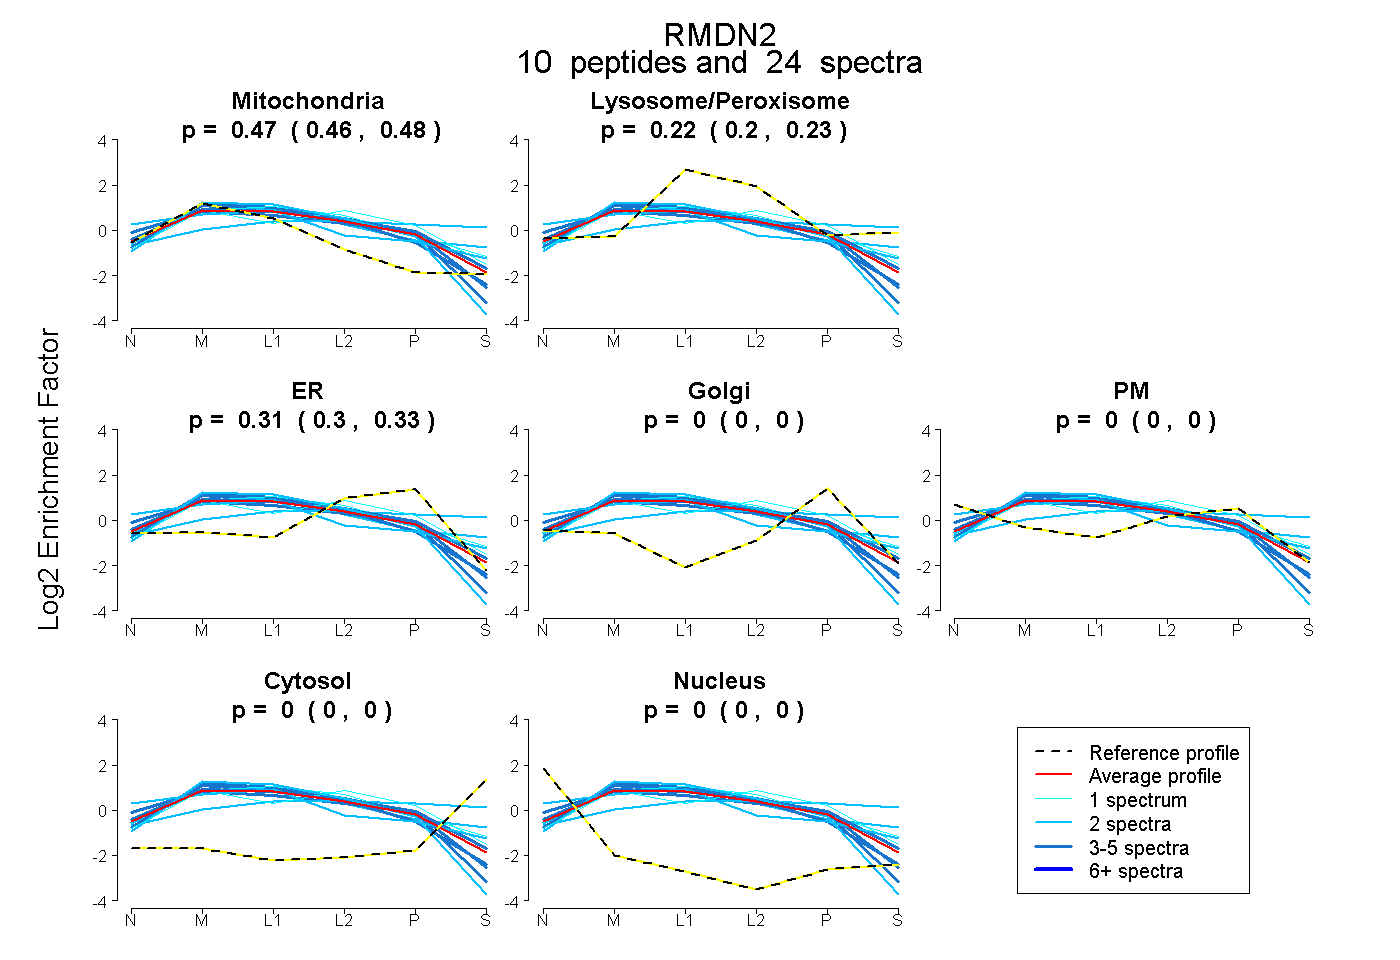 |
0.471
0.459 | 0.481 |
|
0.215
0.196 | 0.232 |
|
0.313
0.299 | 0.325 |
0.000
0.000 | 0.000 |
0.000
0.000 | 0.000 |
0.000
0.000 | 0.000 |
0.000
0.000 | 0.000 |
|
| 4 spectra, CYVDLGESR |
0.537 |
|
0.061 |
|
0.402 |
0.000 |
0.000 |
0.000 |
0.000 |
|
| 4 spectra, GQLQILEK |
0.496 |
|
0.097 |
|
0.369 |
0.000 |
0.039 |
0.000 |
0.000 |
|
| 3 spectra, LEECIQDELGVR |
0.437 |
|
0.242 |
|
0.322 |
0.000 |
0.000 |
0.000 |
0.000 |
|
| 1 spectrum, MESFELLCDHK |
0.328 |
|
0.215 |
|
0.457 |
0.000 |
0.000 |
0.000 |
0.000 |
|
| 2 spectra, VTVHQVSPQHR |
0.458 |
|
0.242 |
|
0.000 |
0.000 |
0.299 |
0.000 |
0.000 |
|
| 1 spectrum, LDVLLQK |
0.405 |
|
0.375 |
|
0.220 |
0.000 |
0.000 |
0.000 |
0.000 |
|
| 2 spectra, LNEAHK |
0.594 |
|
0.034 |
|
0.372 |
0.000 |
0.000 |
0.000 |
0.000 |
|
| 3 spectra, INCGHLFK |
0.585 |
|
0.168 |
|
0.247 |
0.000 |
0.000 |
0.000 |
0.000 |
|
| 2 spectra, HYANVGK |
0.000 |
|
0.538 |
|
0.000 |
0.282 |
0.000 |
0.181 |
0.000 |
|
| 2 spectra, FCNLALLLPIVTK |
0.423 |
|
0.418 |
|
0.000 |
0.150 |
0.000 |
0.009 |
0.000 |
|
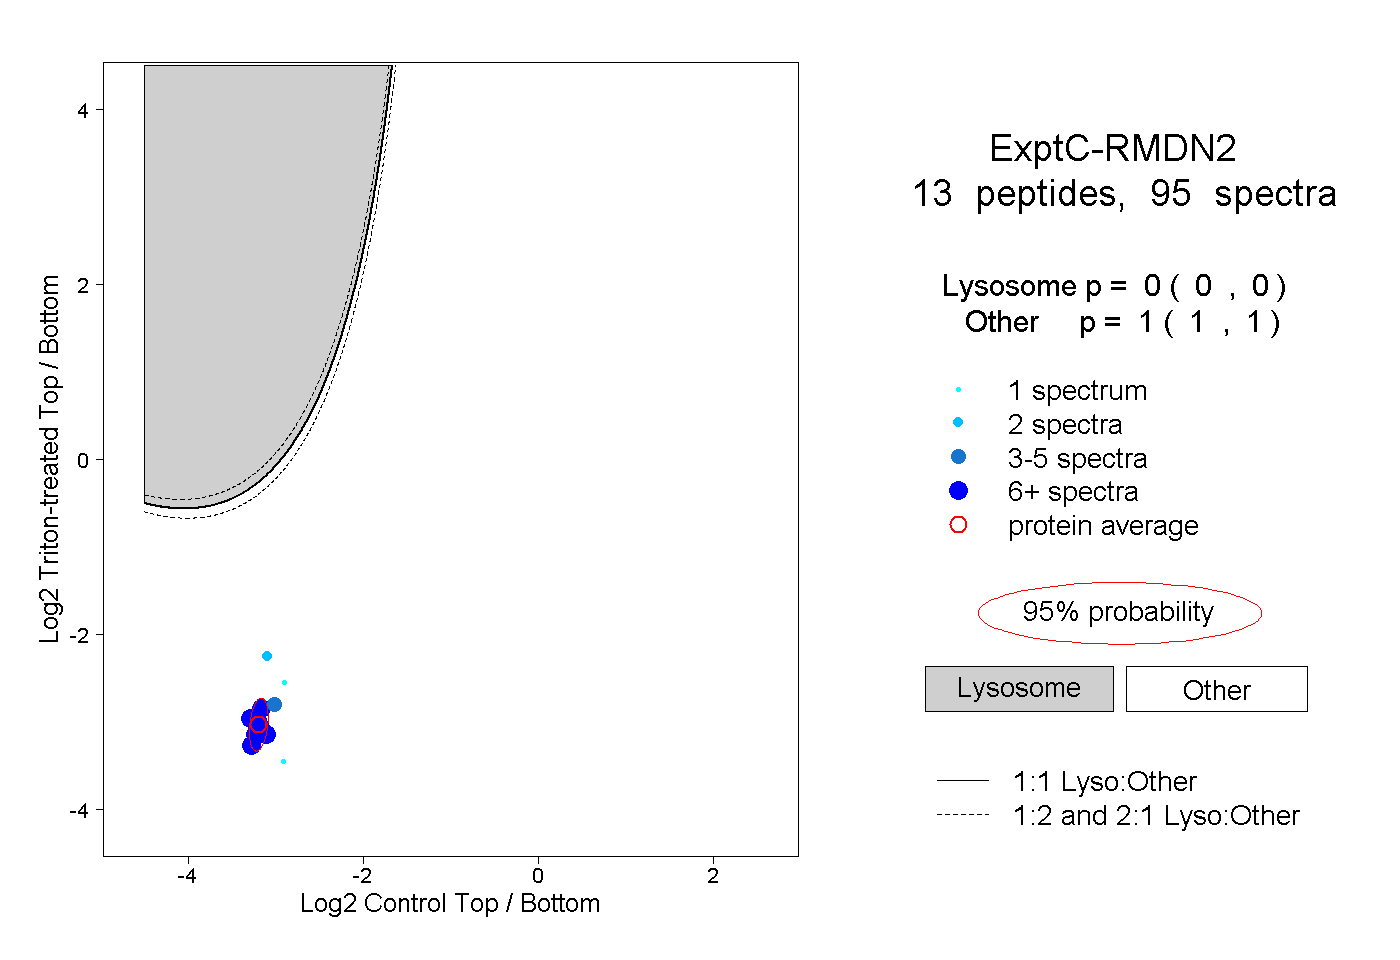
| | | Plot |
|
Lyso |
|
|
|
|
|
|
|
Other |
| Expt C |
13
peptides |
95
spectra |
 |
|
0.000
0.000 | 0.000 |
|
|
|
|
|
|
|
1.000
1.000 | 1.000 |
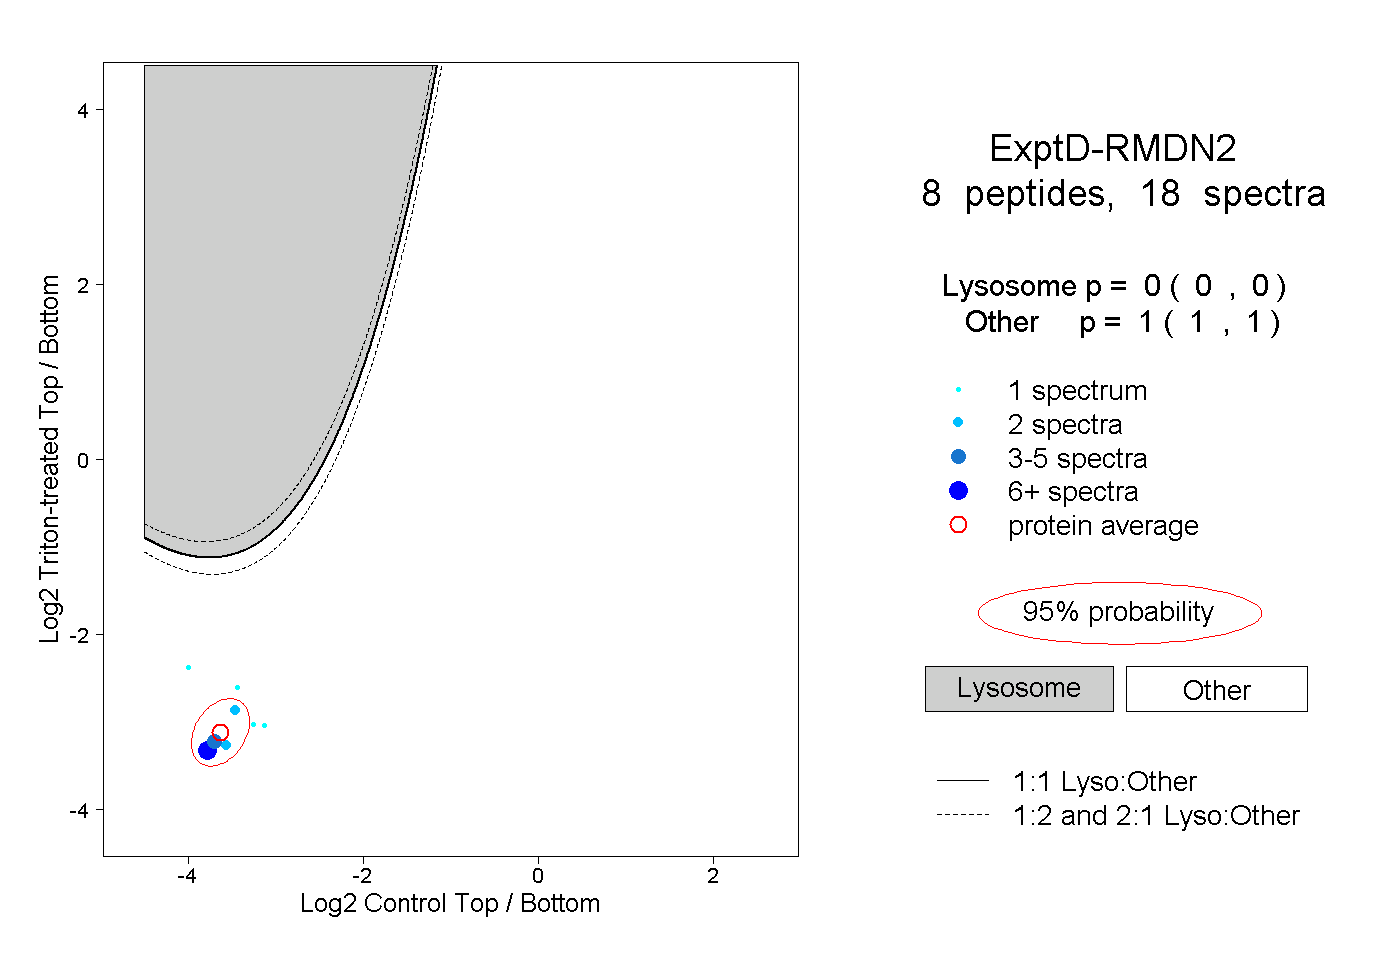
| | | Plot |
|
Lyso |
|
|
|
|
|
|
|
Other |
| Expt D |
8
peptides |
18
spectra |
 |
|
0.000
0.000 | 0.000 |
|
|
|
|
|
|
|
1.000
1.000 | 1.000 |