 26
26peptides
spectra
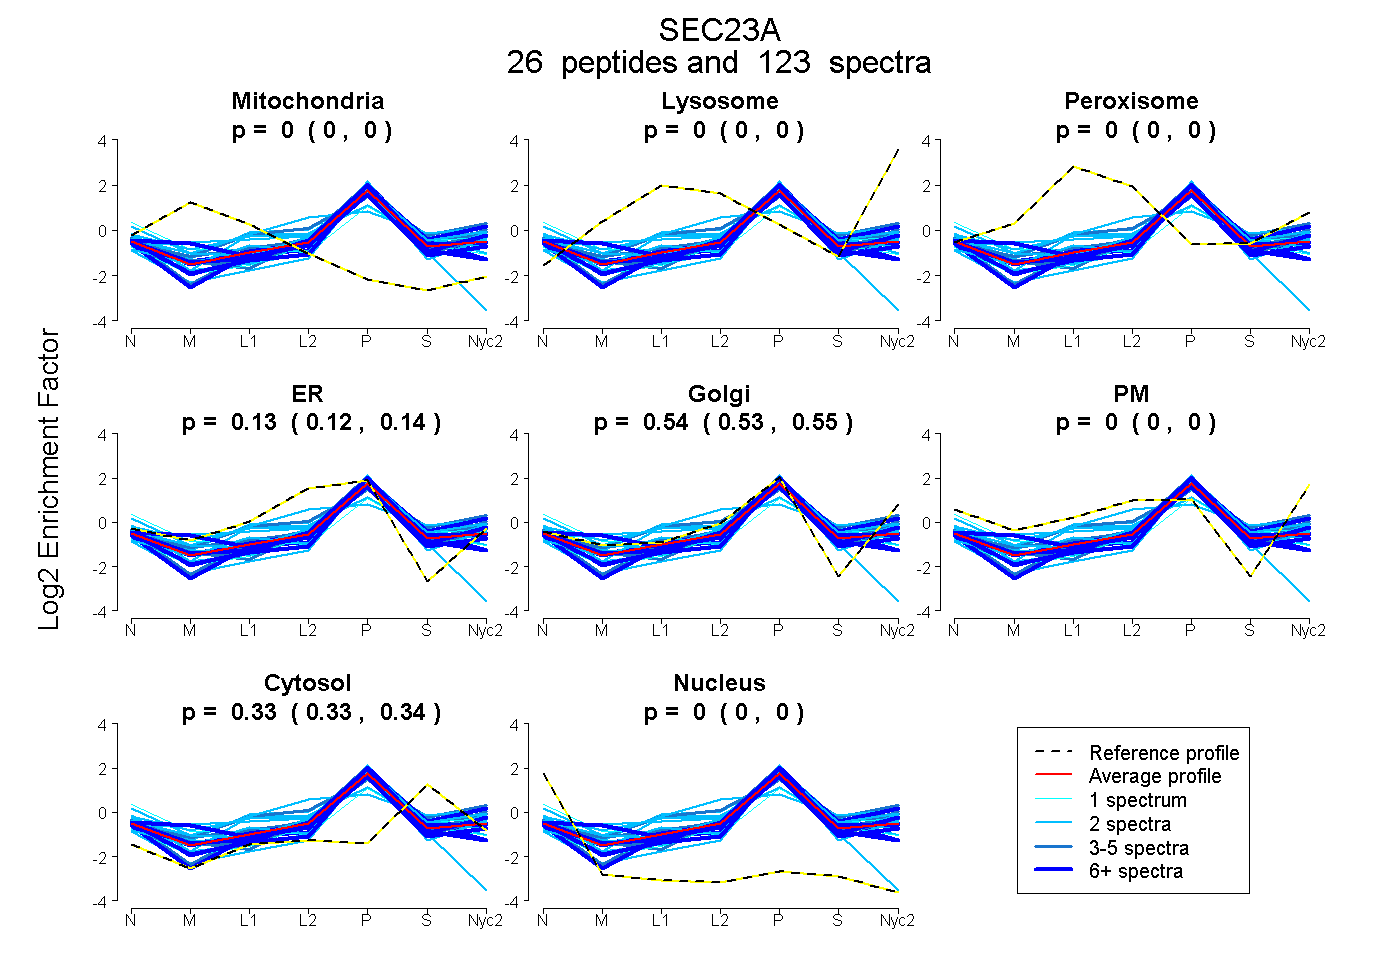
0.000 | 0.000
0.000 | 0.000
0.000 | 0.000
0.120 | 0.135
0.529 | 0.546
0.000 | 0.000
0.331 | 0.335
0.000 | 0.000
19peptides
spectra

0.000 | 0.000
0.139 | 0.153
0.000 | 0.000
0.711 | 0.723
0.000 | 0.000
0.132 | 0.140
0.000 | 0.000
24peptides
spectra

0.000 | 0.000
1.000 | 1.000
9peptides
spectra
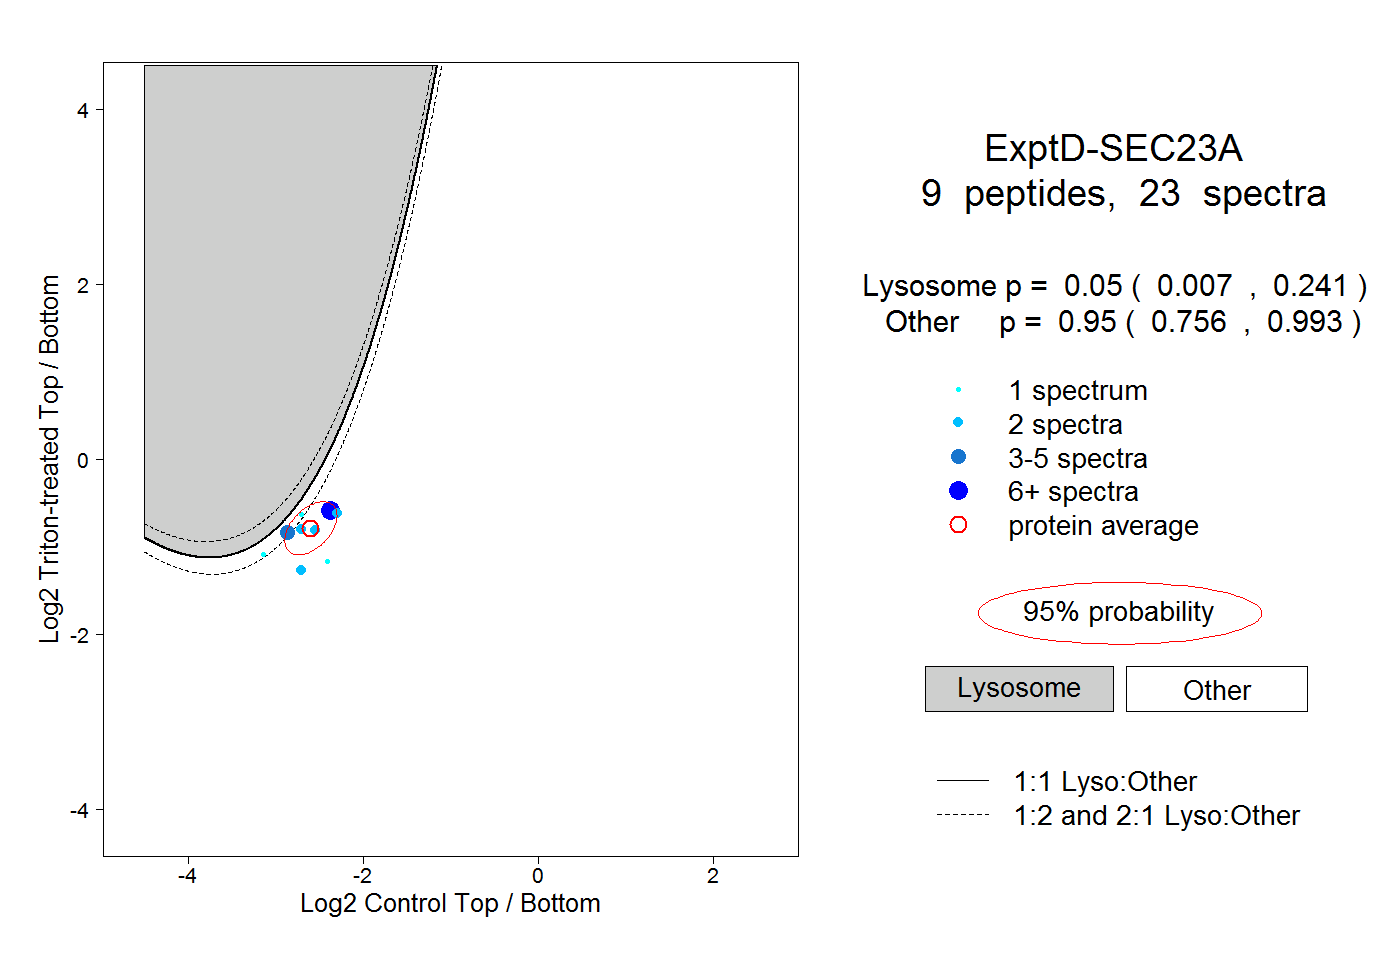
0.007 | 0.241
0.756 | 0.993