 22
22peptides
spectra
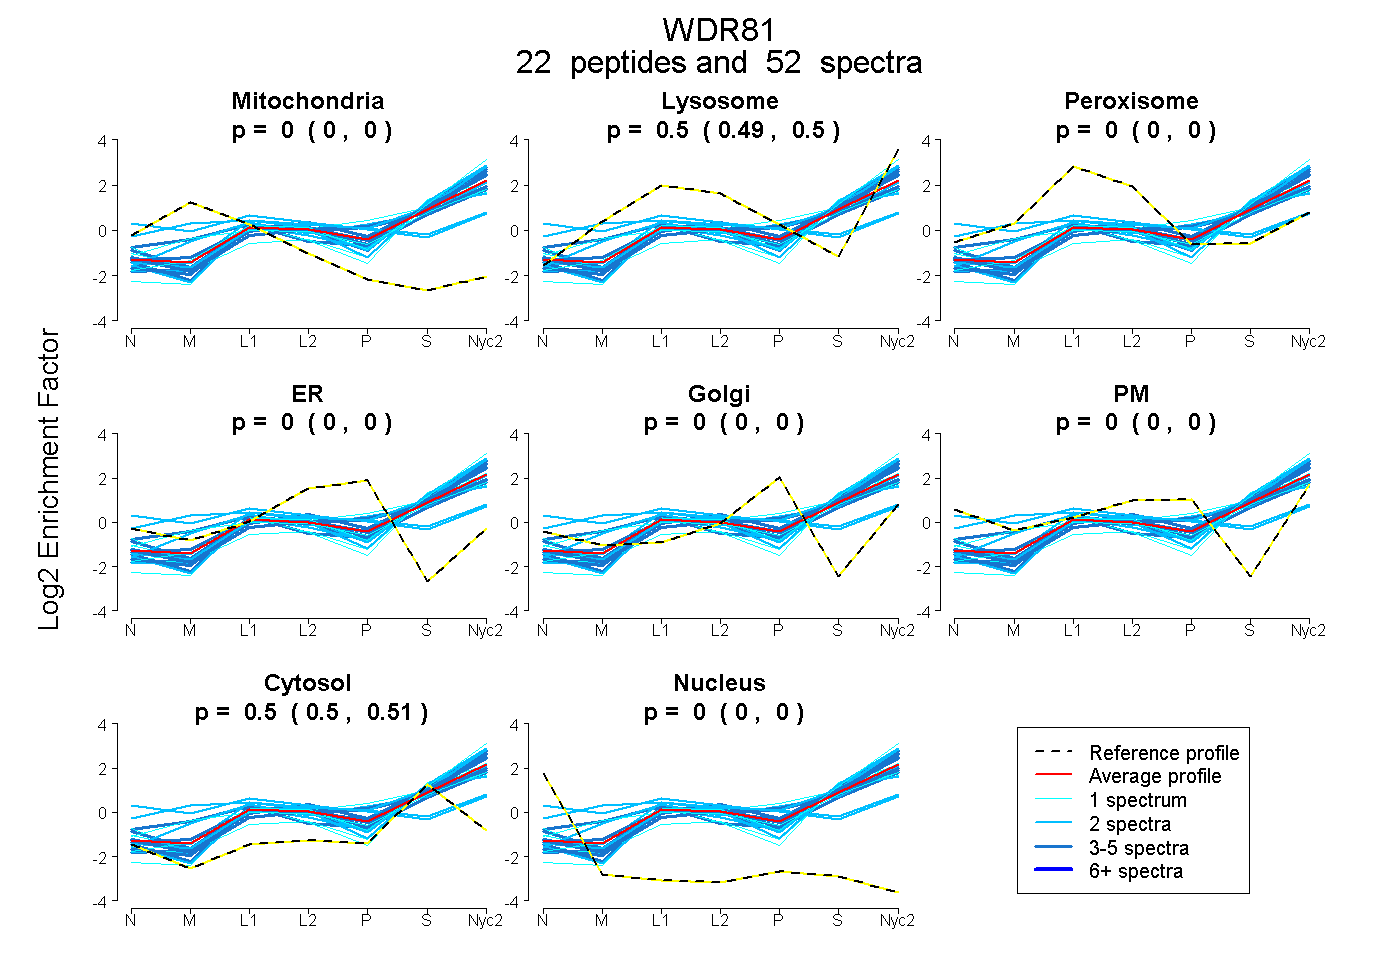
0.000 | 0.000
0.493 | 0.501
0.000 | 0.000
0.000 | 0.000
0.000 | 0.000
0.000 | 0.000
0.499 | 0.506
0.000 | 0.000
6peptides
spectra
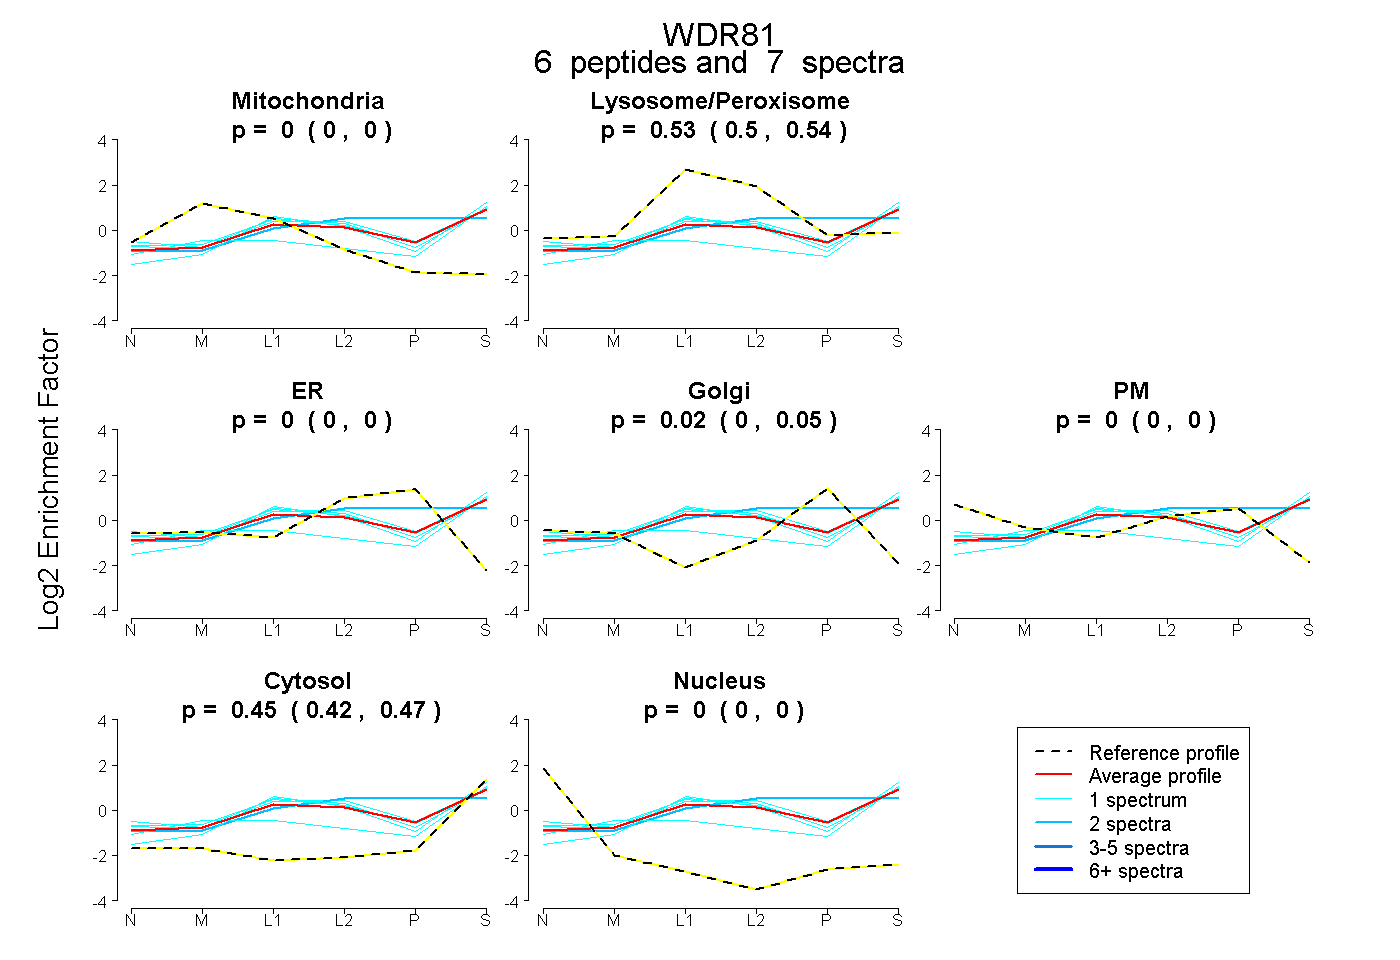
0.000 | 0.000
0.502 | 0.542
0.000 | 0.000
0.000 | 0.053
0.000 | 0.000
0.421 | 0.470
0.000 | 0.000
25peptides
spectra
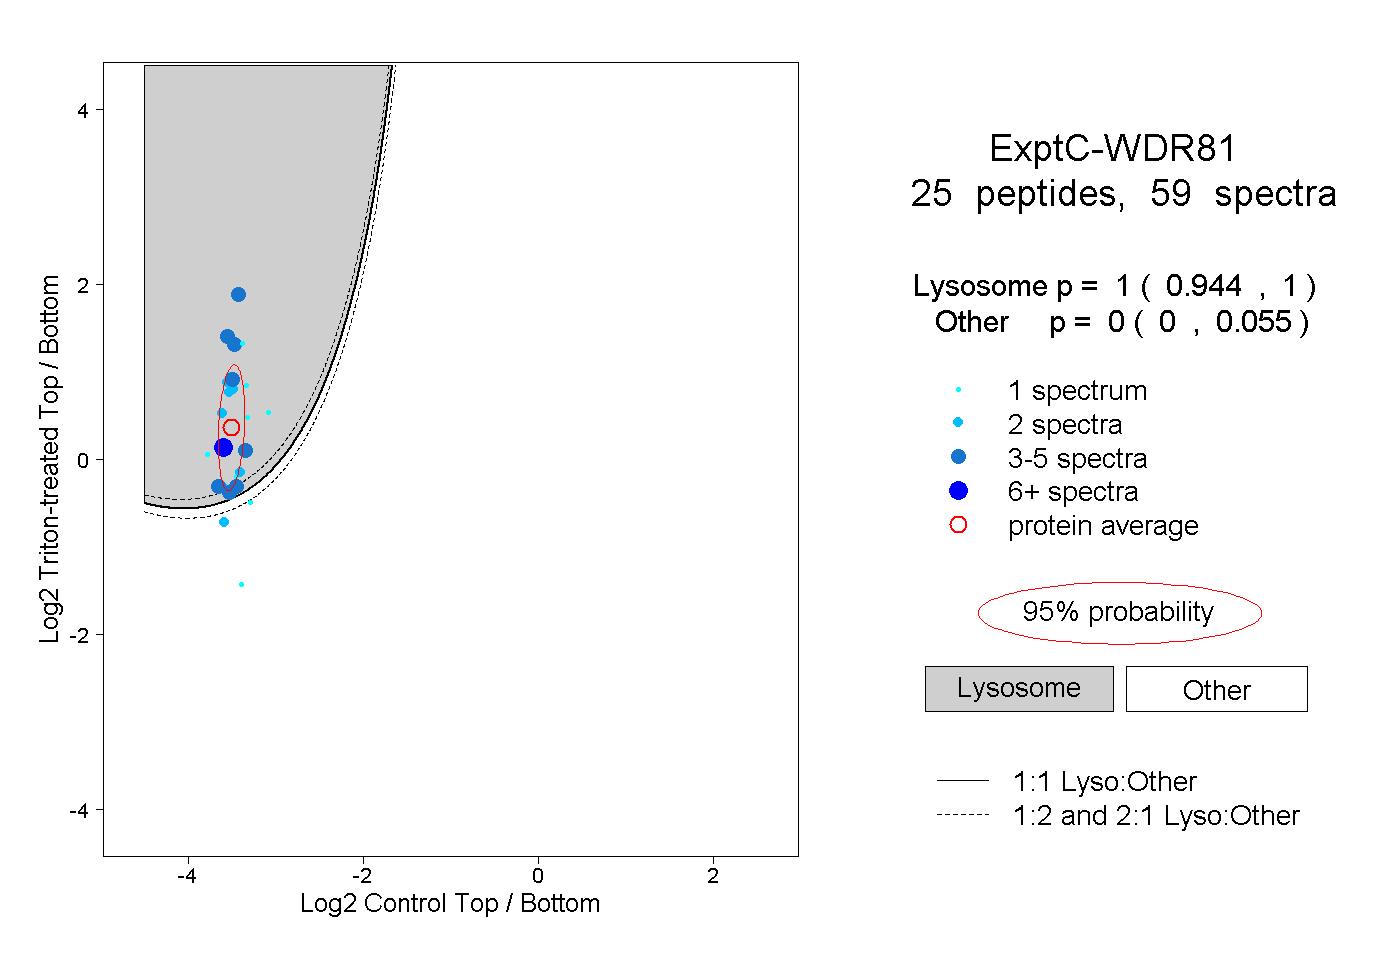
0.944 | 1.000
0.000 | 0.055
5peptides
spectra
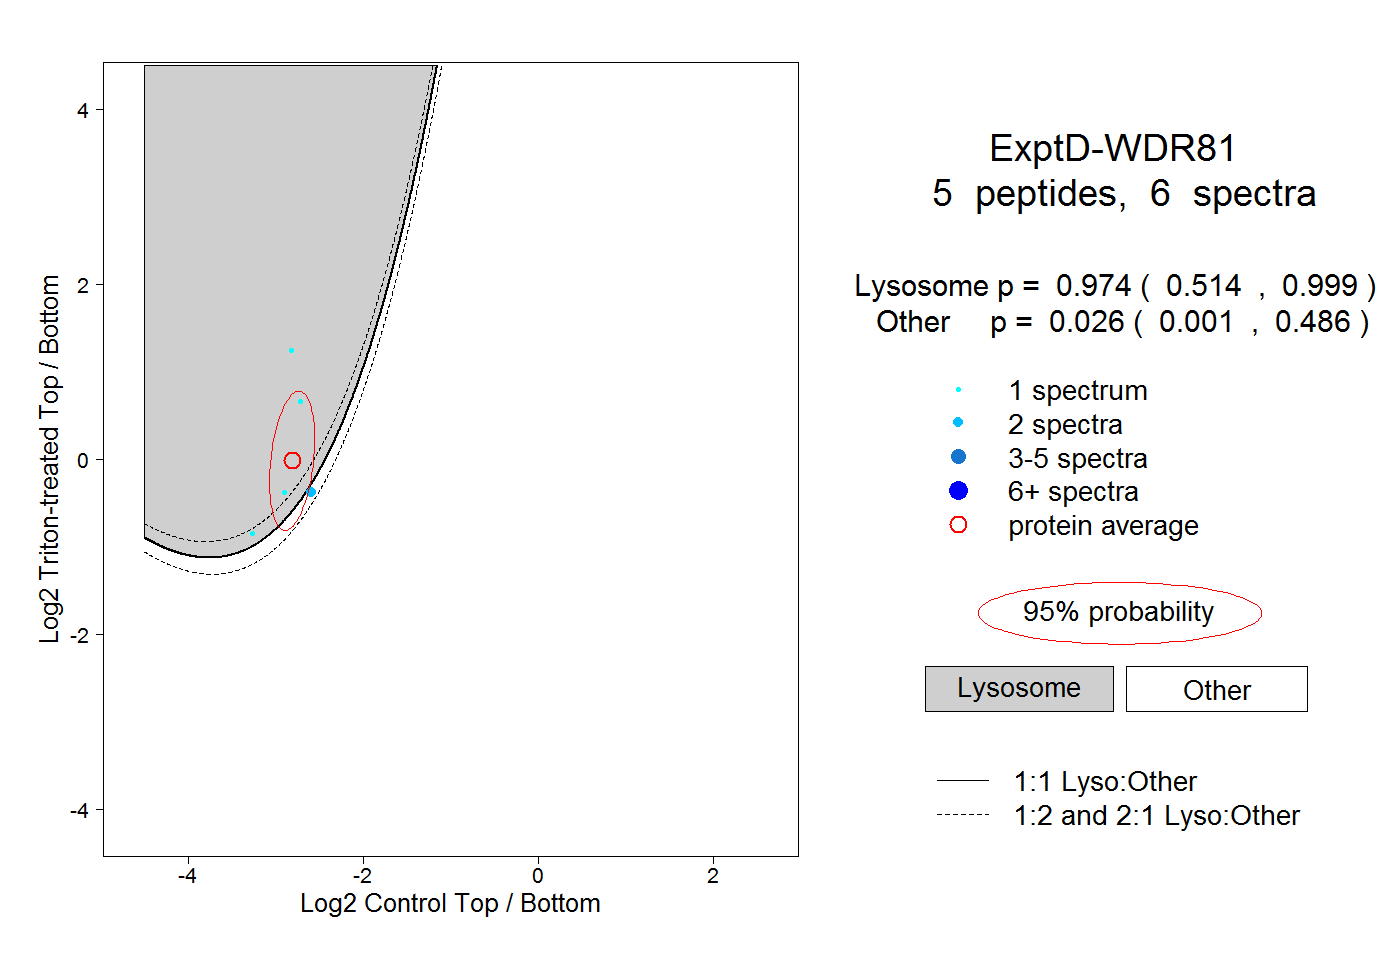
0.514 | 0.999
0.001 | 0.486