 22
22peptides
spectra
0.000 | 0.000
0.493 | 0.501
0.000 | 0.000
0.000 | 0.000
0.000 | 0.000
0.000 | 0.000
0.499 | 0.506
0.000 | 0.000
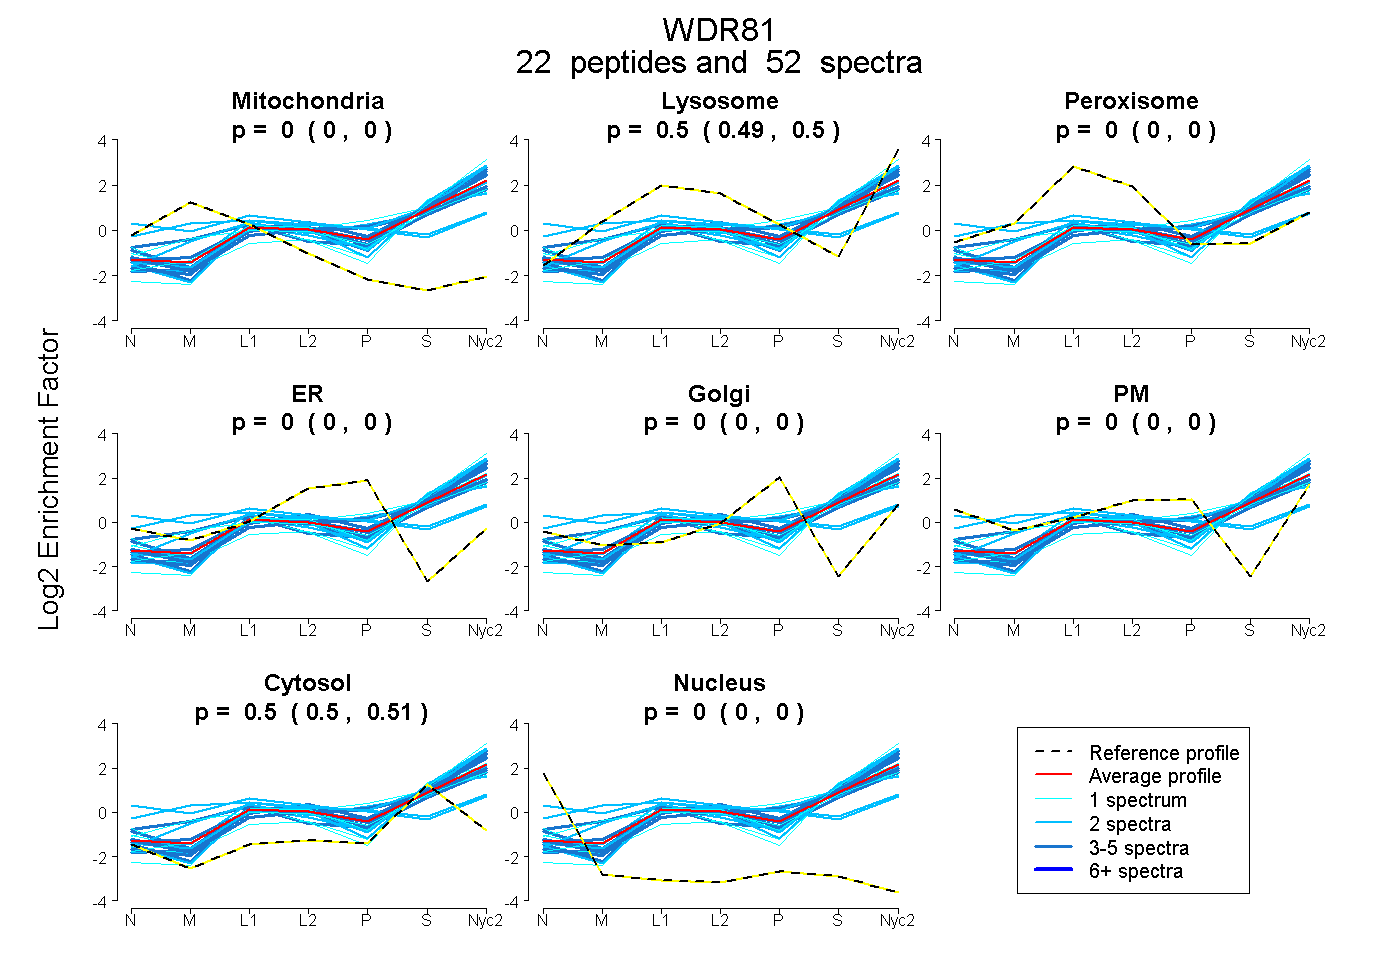
| Plot | Mito | Lyso | Perox | ER | Golgi | PM | Cytosol | Nucleus | |||||
| Expt A |
22 peptides |
52 spectra |
|
0.000 0.000 | 0.000 |
0.497 0.493 | 0.501 |
0.000 0.000 | 0.000 |
0.000 0.000 | 0.000 |
0.000 0.000 | 0.000 |
0.000 0.000 | 0.000 |
0.503 0.499 | 0.506 |
0.000 0.000 | 0.000 |
| 2 spectra, LLTSCYVGPTR | 0.000 | 0.452 | 0.000 | 0.000 | 0.000 | 0.000 | 0.548 | 0.000 | ||
| 1 spectrum, WLASLR | 0.000 | 0.561 | 0.000 | 0.000 | 0.000 | 0.000 | 0.439 | 0.000 | ||
| 1 spectrum, YLLKPLIGAYENPCR | 0.000 | 0.509 | 0.000 | 0.000 | 0.000 | 0.000 | 0.491 | 0.000 | ||
| 3 spectra, SLAVSPSGR | 0.000 | 0.475 | 0.000 | 0.000 | 0.009 | 0.000 | 0.516 | 0.000 | ||
| 4 spectra, LGGGLNPGLVR | 0.000 | 0.530 | 0.000 | 0.000 | 0.000 | 0.000 | 0.470 | 0.000 | ||
| 3 spectra, AQWEPHEYPATMER | 0.011 | 0.498 | 0.000 | 0.000 | 0.000 | 0.000 | 0.491 | 0.000 | ||
| 1 spectrum, GCTEGQLPEATFSDGQR | 0.000 | 0.374 | 0.000 | 0.000 | 0.000 | 0.000 | 0.626 | 0.000 | ||
| 4 spectra, QLALAPGGTHVVALVSTR | 0.000 | 0.521 | 0.000 | 0.000 | 0.000 | 0.000 | 0.479 | 0.000 | ||
| 1 spectrum, DGEGRPGCPTCQK | 0.000 | 0.340 | 0.000 | 0.000 | 0.000 | 0.000 | 0.660 | 0.000 | ||
| 2 spectra, VEDEVQGR | 0.000 | 0.551 | 0.000 | 0.000 | 0.000 | 0.000 | 0.449 | 0.000 | ||
| 3 spectra, LSSENFR | 0.000 | 0.516 | 0.000 | 0.000 | 0.000 | 0.000 | 0.484 | 0.000 | ||
| 3 spectra, ATGLDSGEGDEGK | 0.000 | 0.464 | 0.000 | 0.000 | 0.000 | 0.000 | 0.536 | 0.000 | ||
| 1 spectrum, GWPAHEGDILQIK | 0.000 | 0.459 | 0.000 | 0.000 | 0.004 | 0.000 | 0.537 | 0.000 | ||
| 5 spectra, FILLYQAR | 0.000 | 0.519 | 0.000 | 0.000 | 0.000 | 0.000 | 0.481 | 0.000 | ||
| 4 spectra, AEGLGEAEVR | 0.000 | 0.473 | 0.000 | 0.000 | 0.000 | 0.000 | 0.527 | 0.000 | ||
| 2 spectra, LIYAQHR | 0.000 | 0.573 | 0.000 | 0.000 | 0.000 | 0.000 | 0.427 | 0.000 | ||
| 2 spectra, LGPTVASR | 0.000 | 0.489 | 0.000 | 0.000 | 0.000 | 0.000 | 0.511 | 0.000 | ||
| 2 spectra, HVVEVTPCESGWTR | 0.033 | 0.000 | 0.336 | 0.000 | 0.000 | 0.389 | 0.243 | 0.000 | ||
| 1 spectrum, GLVLDWVHGR | 0.000 | 0.494 | 0.000 | 0.000 | 0.000 | 0.000 | 0.506 | 0.000 | ||
| 2 spectra, SVLCGHVR | 0.094 | 0.167 | 0.227 | 0.000 | 0.028 | 0.231 | 0.253 | 0.000 | ||
| 2 spectra, GSSACPSLLR | 0.000 | 0.442 | 0.000 | 0.000 | 0.000 | 0.000 | 0.558 | 0.000 | ||
| 3 spectra, VEVHGLR | 0.000 | 0.468 | 0.000 | 0.000 | 0.000 | 0.000 | 0.532 | 0.000 |
| Plot | Mito | Lyso or Perox | ER | Golgi | PM | Cytosol | Nucleus | ||||||
| Expt B |
6 peptides |
7 spectra |
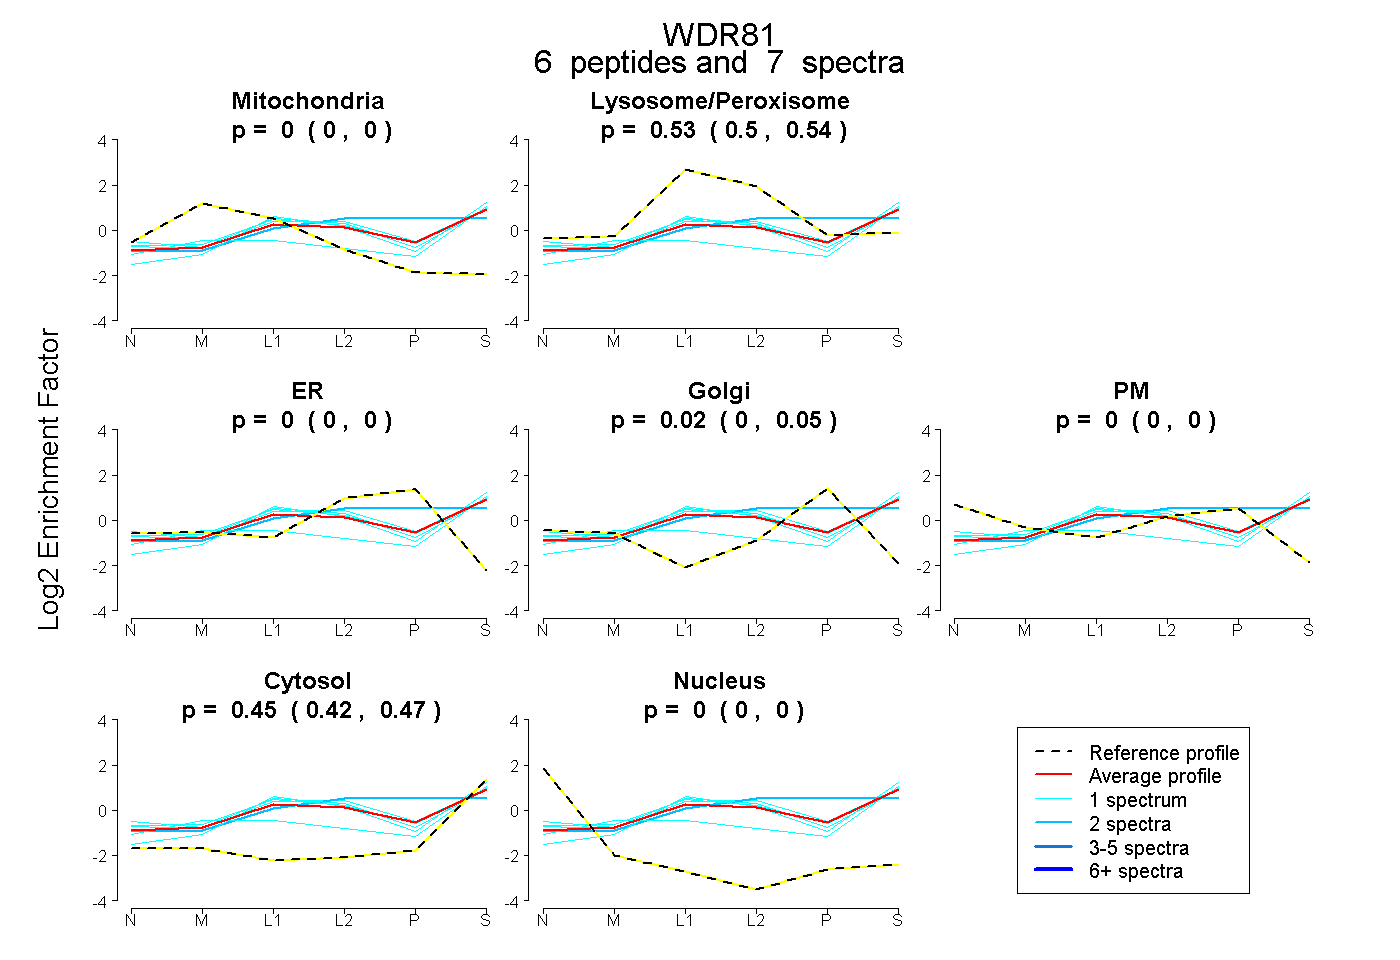 |
0.000 0.000 | 0.000 |
0.526 0.502 | 0.542 |
0.000 0.000 | 0.000 |
0.024 0.000 | 0.053 |
0.000 0.000 | 0.000 |
0.450 0.421 | 0.470 |
0.000 0.000 | 0.000 |
|||
| Plot | Lyso | Other | |||||||||||
| Expt C |
25 peptides |
59 spectra |
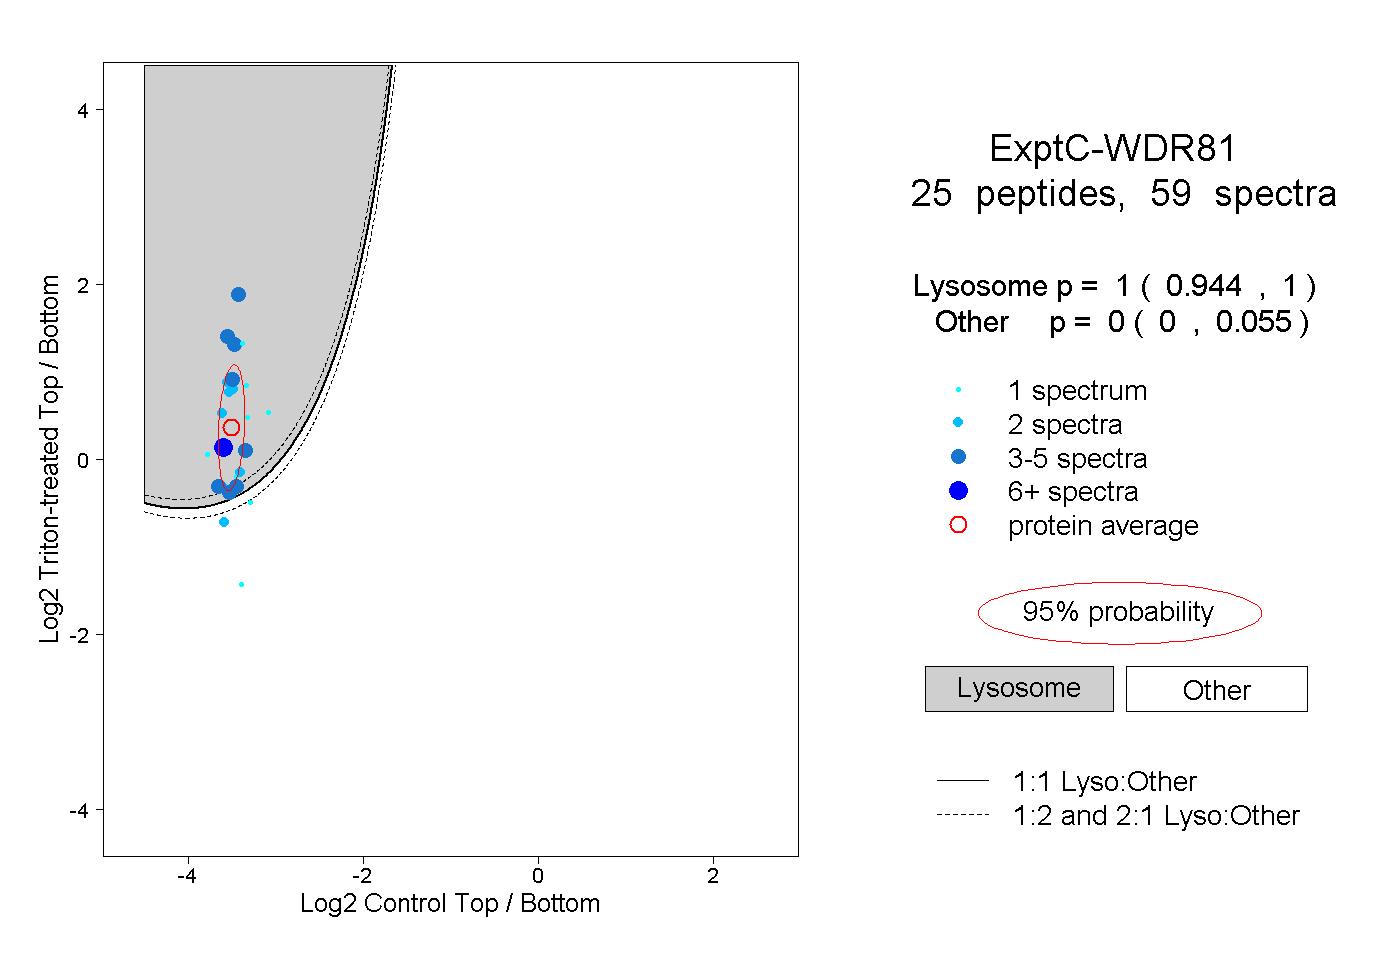 |
1.000 0.944 | 1.000 |
0.000 0.000 | 0.055 |
||||||||
| Plot | Lyso | Other | |||||||||||
| Expt D |
5 peptides |
6 spectra |
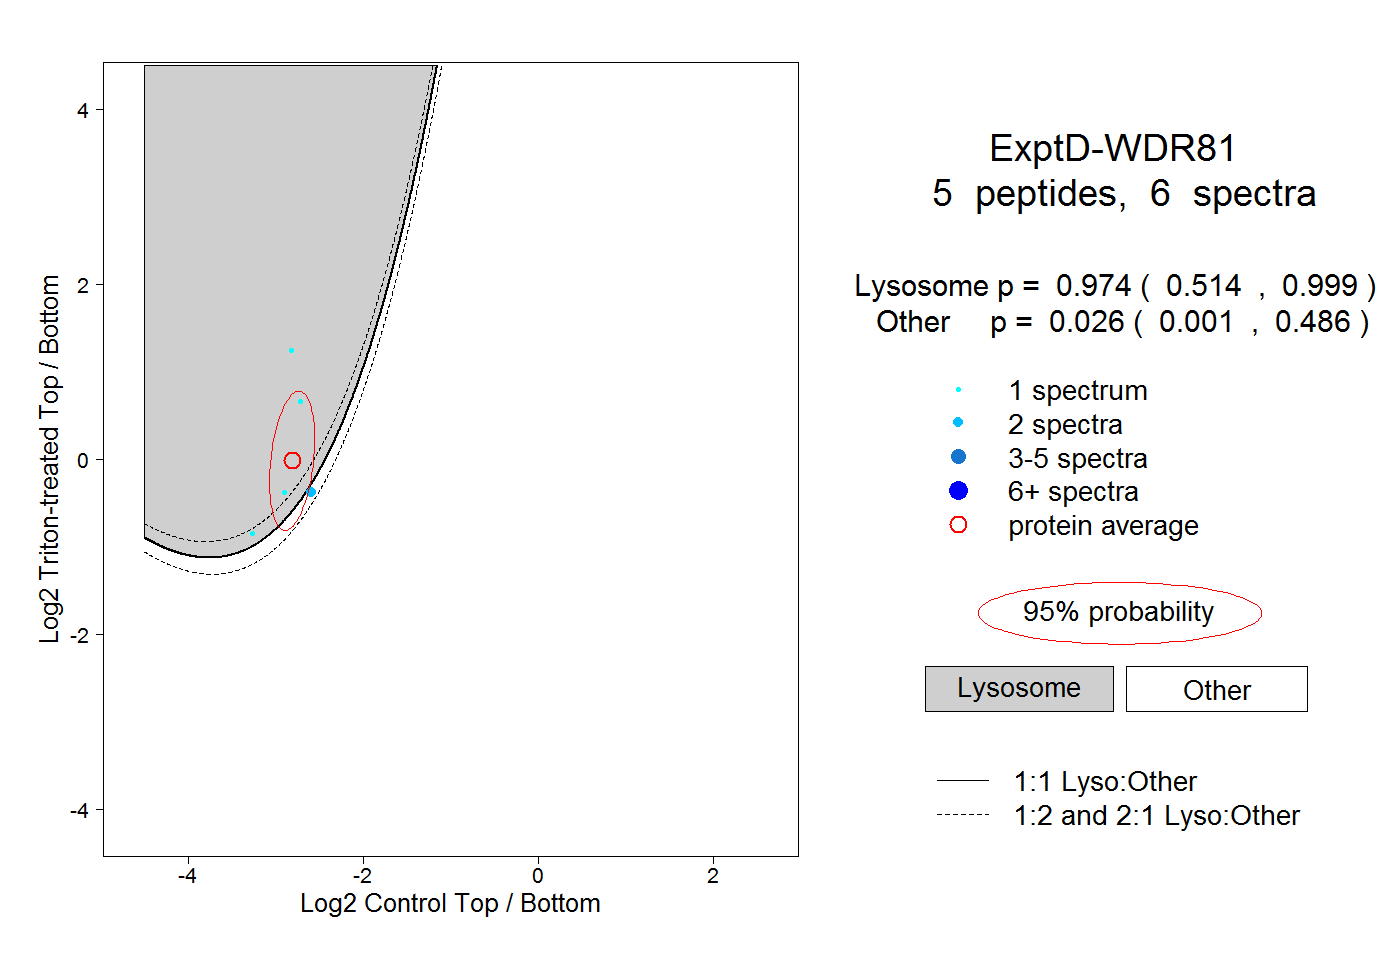 |
0.974 0.514 | 0.999 |
0.026 0.001 | 0.486 |