| 2 spectra, LLTSCYVGPTR |
|
1.000 |
|
|
|
|
|
|
|
0.000 |
| 2 spectra, LSYPLSR |
|
1.000 |
|
|
|
|
|
|
|
0.000 |
| 1 spectrum, IVLPEGFSPIQALEELEK |
|
1.000 |
|
|
|
|
|
|
|
0.000 |
| 1 spectrum, RPVDPTLLEELQK |
|
0.999 |
|
|
|
|
|
|
|
0.001 |
| 2 spectra, LTNSQAK |
|
1.000 |
|
|
|
|
|
|
|
0.000 |
| 1 spectrum, SLAVSPSGR |
|
1.000 |
|
|
|
|
|
|
|
0.000 |
| 2 spectra, LGGGLNPGLVR |
|
0.934 |
|
|
|
|
|
|
|
0.066 |
| 4 spectra, AQWEPHEYPATMER |
|
0.780 |
|
|
|
|
|
|
|
0.220 |
| 1 spectrum, FMQEVAAQNYR |
|
1.000 |
|
|
|
|
|
|
|
0.000 |
| 3 spectra, LPQGWTR |
|
0.993 |
|
|
|
|
|
|
|
0.007 |
| 1 spectrum, VEDEVQGR |
|
1.000 |
|
|
|
|
|
|
|
0.000 |
| 4 spectra, LSSENFR |
|
1.000 |
|
|
|
|
|
|
|
0.000 |
| 3 spectra, ATGLDSGEGDEGK |
|
1.000 |
|
|
|
|
|
|
|
0.000 |
| 1 spectrum, GGDDGGAPVDK |
|
0.999 |
|
|
|
|
|
|
|
0.001 |
| 1 spectrum, GWPAHEGDILQIK |
|
0.153 |
|
|
|
|
|
|
|
0.847 |
| 2 spectra, ILLDTACK |
|
1.000 |
|
|
|
|
|
|
|
0.000 |
| 2 spectra, DLNIDAR |
|
0.884 |
|
|
|
|
|
|
|
0.116 |
| 5 spectra, VGNFLAR |
|
0.906 |
|
|
|
|
|
|
|
0.094 |
| 2 spectra, FILLYQAR |
|
0.064 |
|
|
|
|
|
|
|
0.936 |
| 3 spectra, AEGLGEAEVR |
|
1.000 |
|
|
|
|
|
|
|
0.000 |
| 6 spectra, LGPTVASR |
|
0.999 |
|
|
|
|
|
|
|
0.001 |
| 1 spectrum, LCSELR |
|
0.921 |
|
|
|
|
|
|
|
0.079 |
| 1 spectrum, HVVEVTPCESGWTR |
|
0.000 |
|
|
|
|
|
|
|
1.000 |
| 4 spectra, GLVLDWVHGR |
|
0.724 |
|
|
|
|
|
|
|
0.276 |
| 4 spectra, VEVHGLR |
|
1.000 |
|
|
|
|
|
|
|
0.000 |
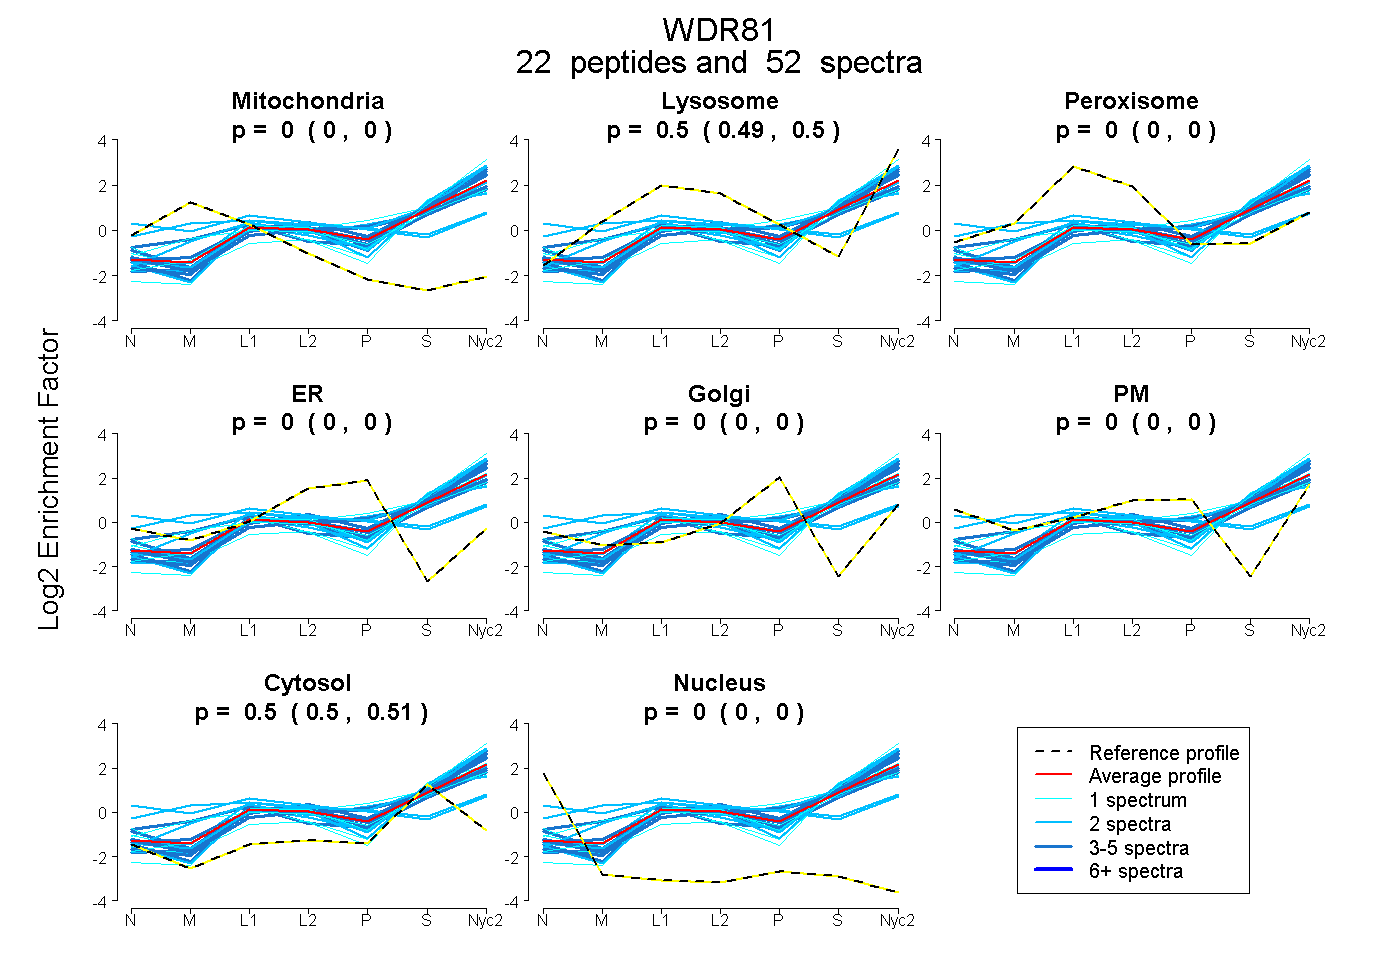
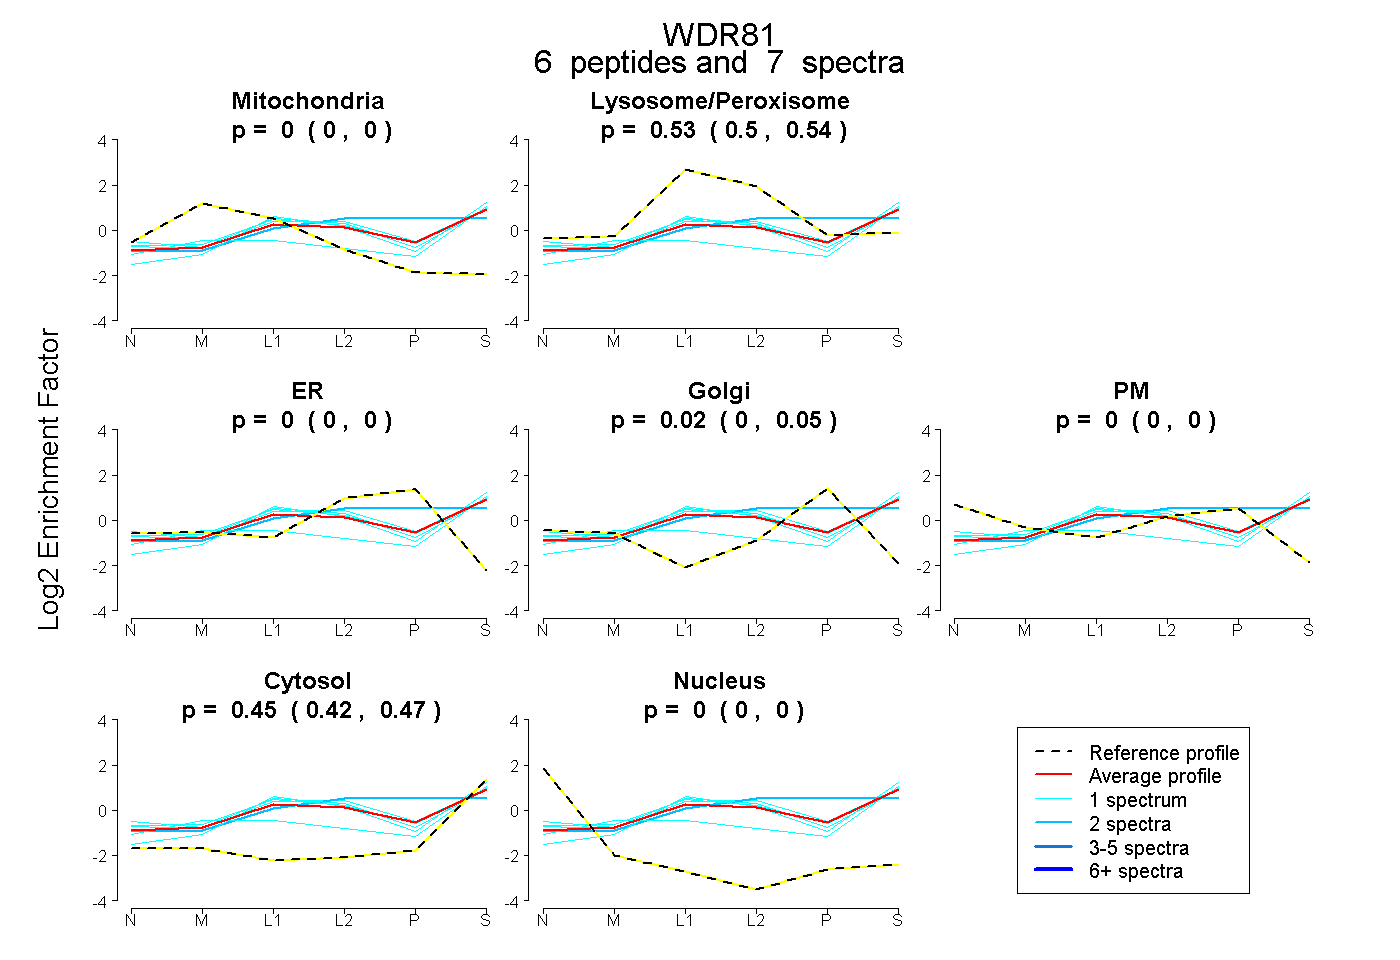
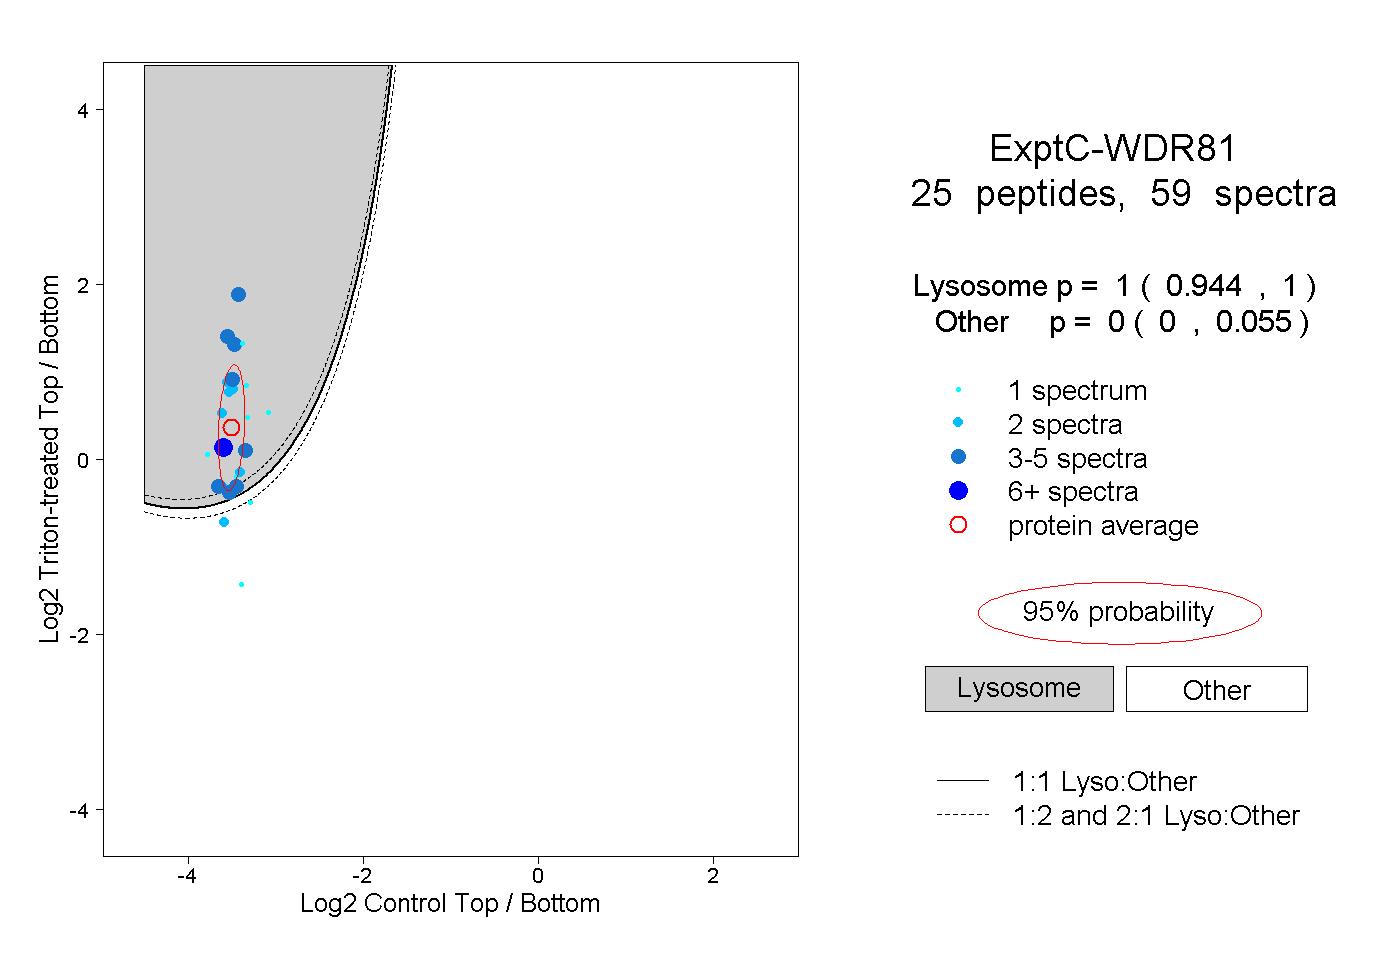
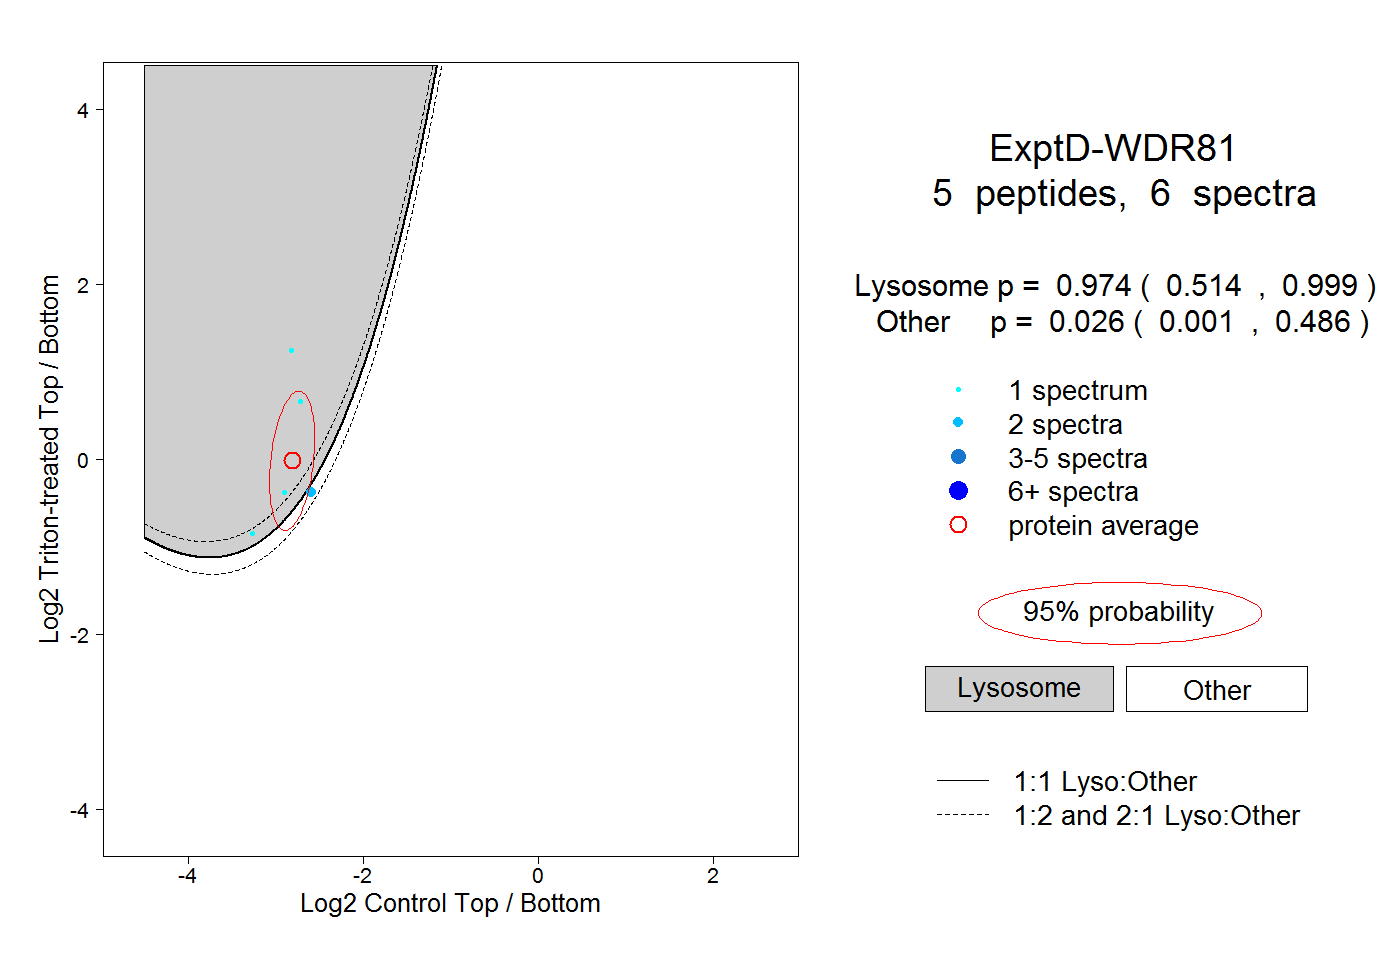
 22
22