 8
8peptides
spectra
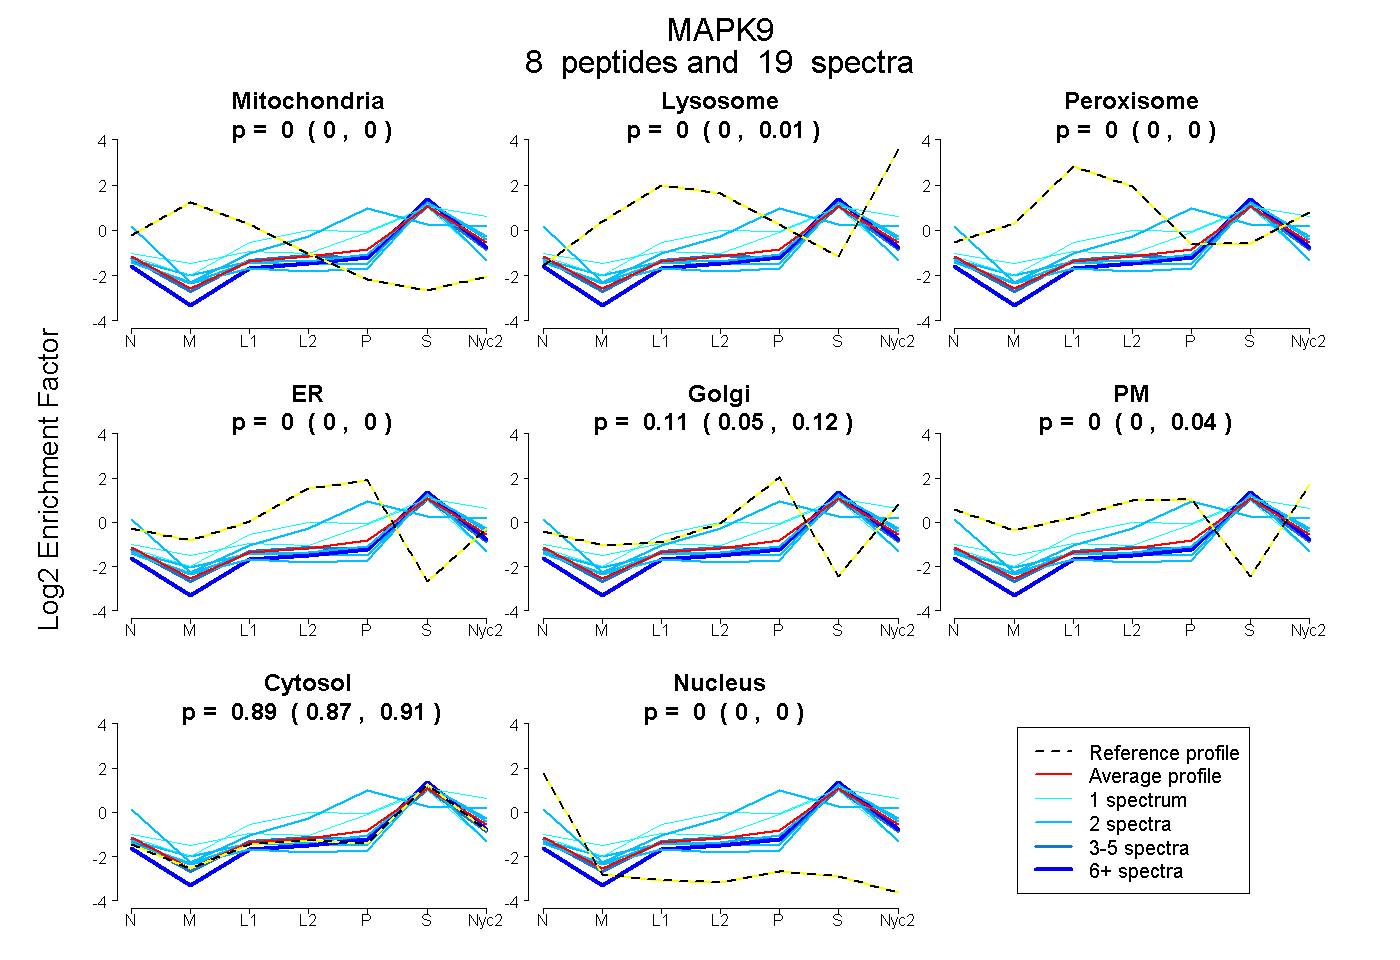
0.000 | 0.000
0.000 | 0.005
0.000 | 0.000
0.000 | 0.000
0.052 | 0.122
0.000 | 0.036
0.874 | 0.909
0.000 | 0.000
3peptides
spectra
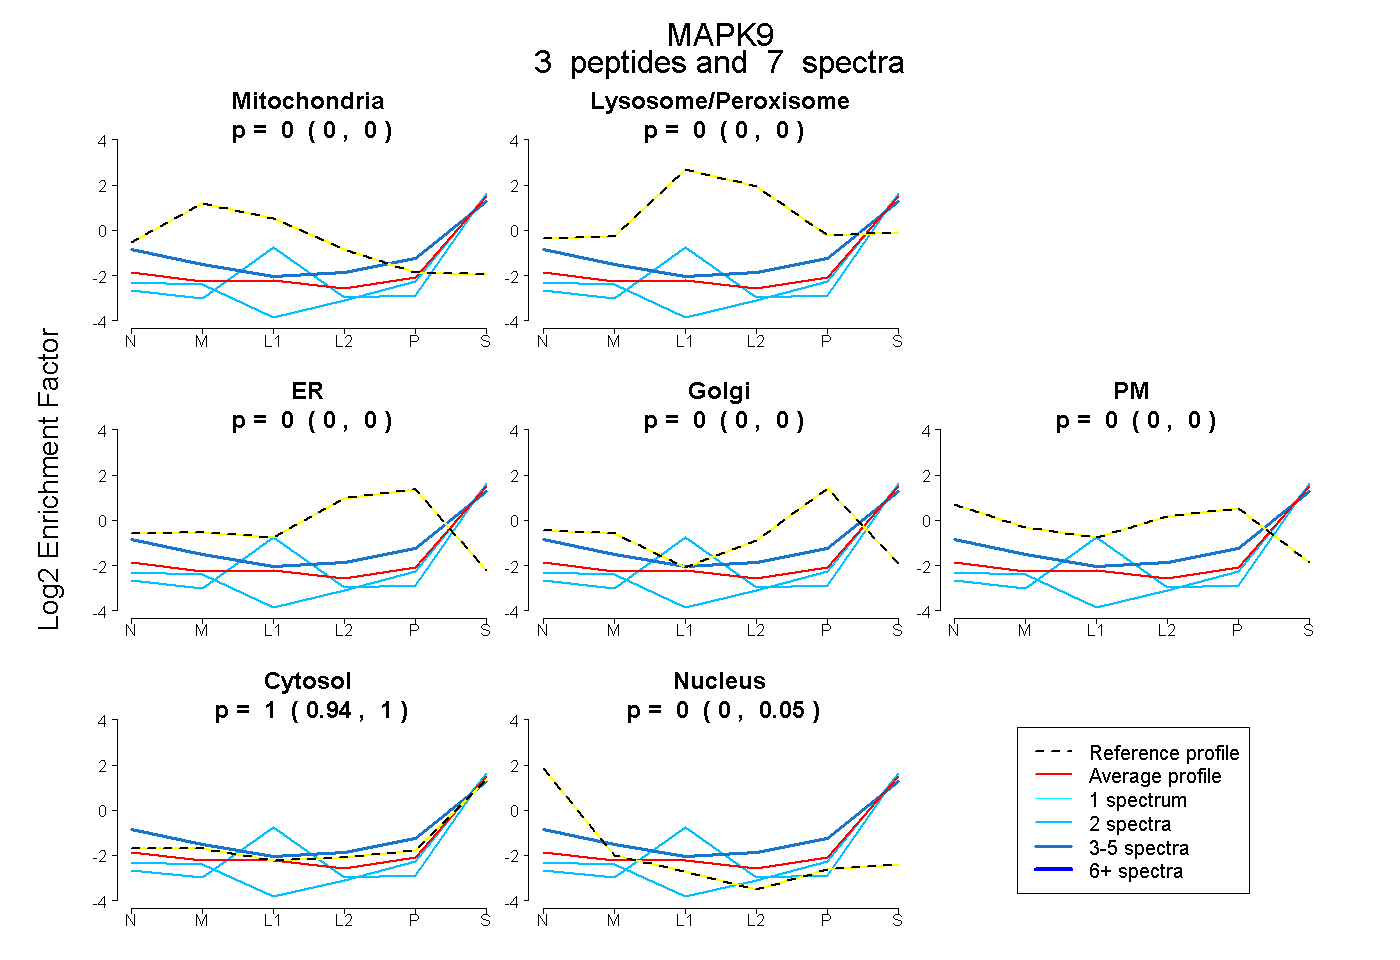
0.000 | 0.000
0.000 | 0.000
0.000 | 0.000
0.000 | 0.000
0.000 | 0.000
0.938 | 1.000
0.000 | 0.050
11peptides
spectra
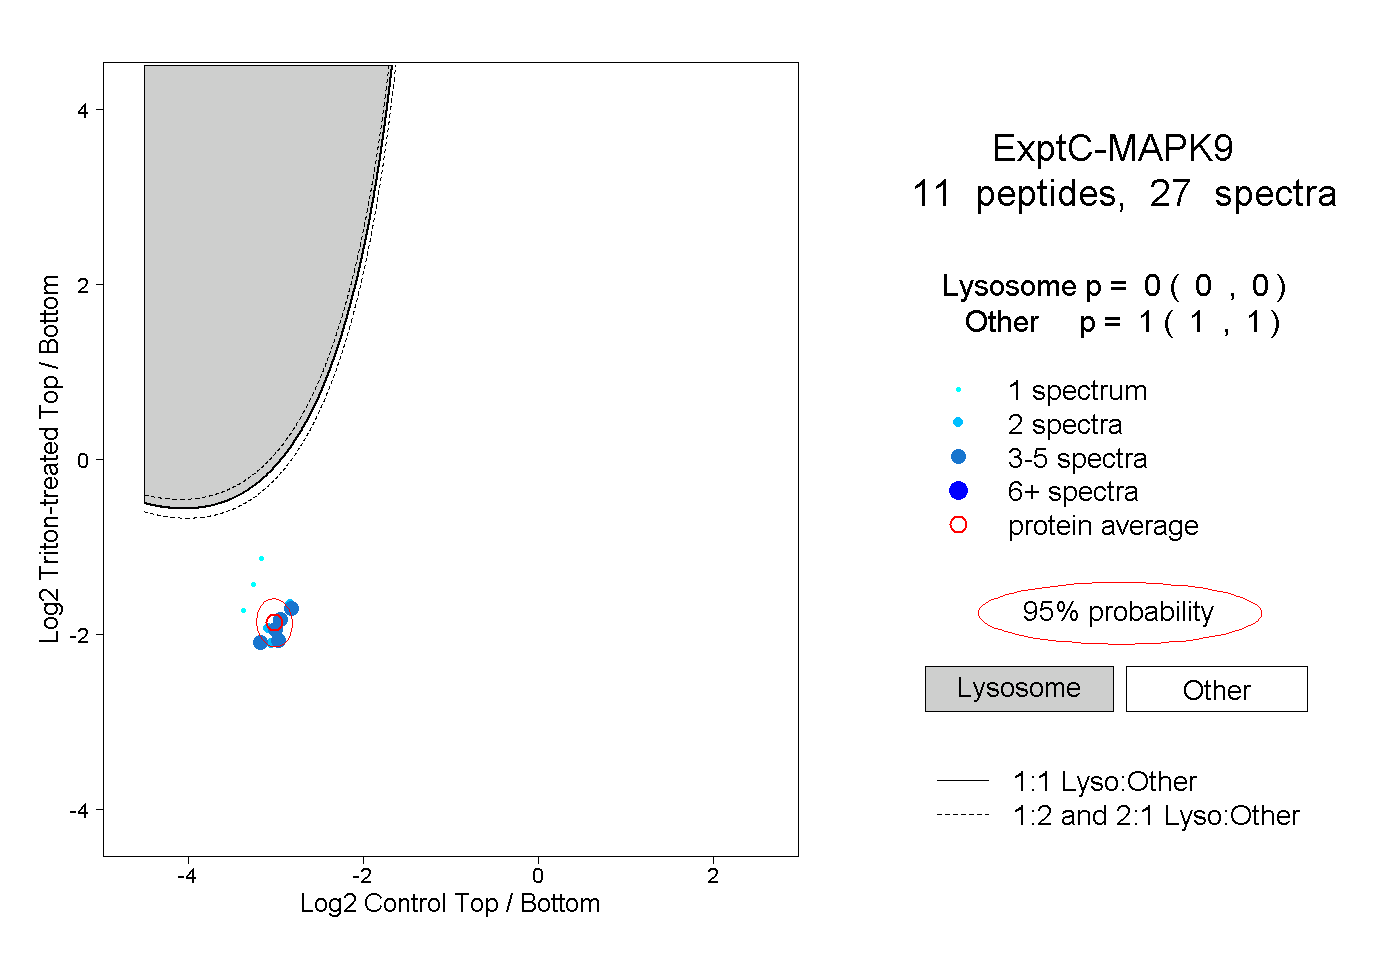
0.000 | 0.000
1.000 | 1.000
1peptide
spectra
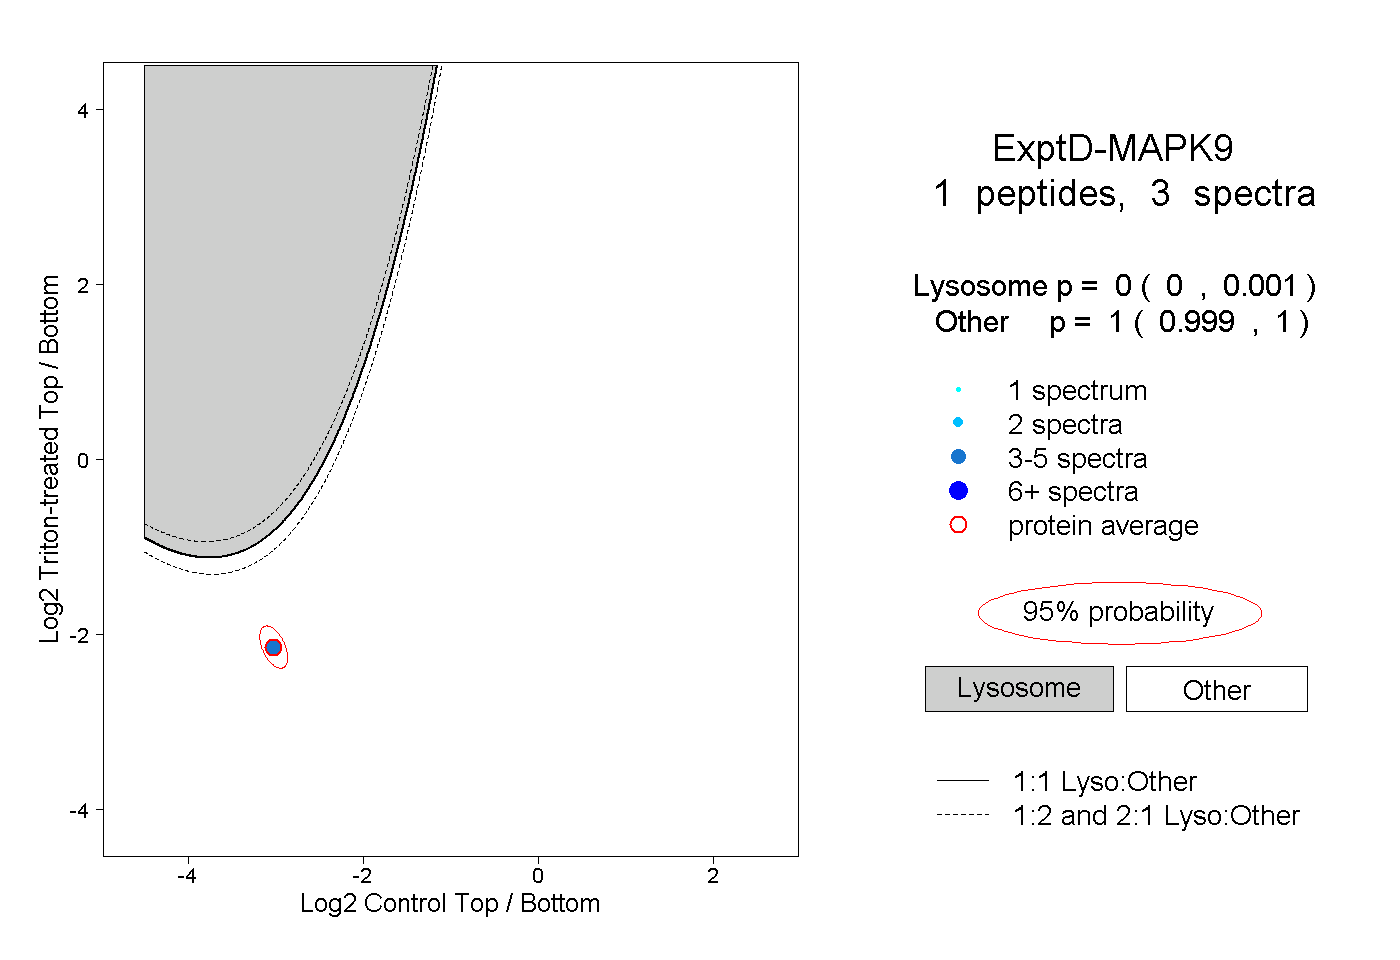
0.000 | 0.001
0.999 | 1.000