MAPK9
[ENSRNOP00000003987]
Main page
| | | Plot |
Mito |
Lyso |
|
Perox |
ER |
Golgi |
PM |
Cytosol |
Nucleus |
|
| Expt A |
 8
8
peptides |
19
spectra |
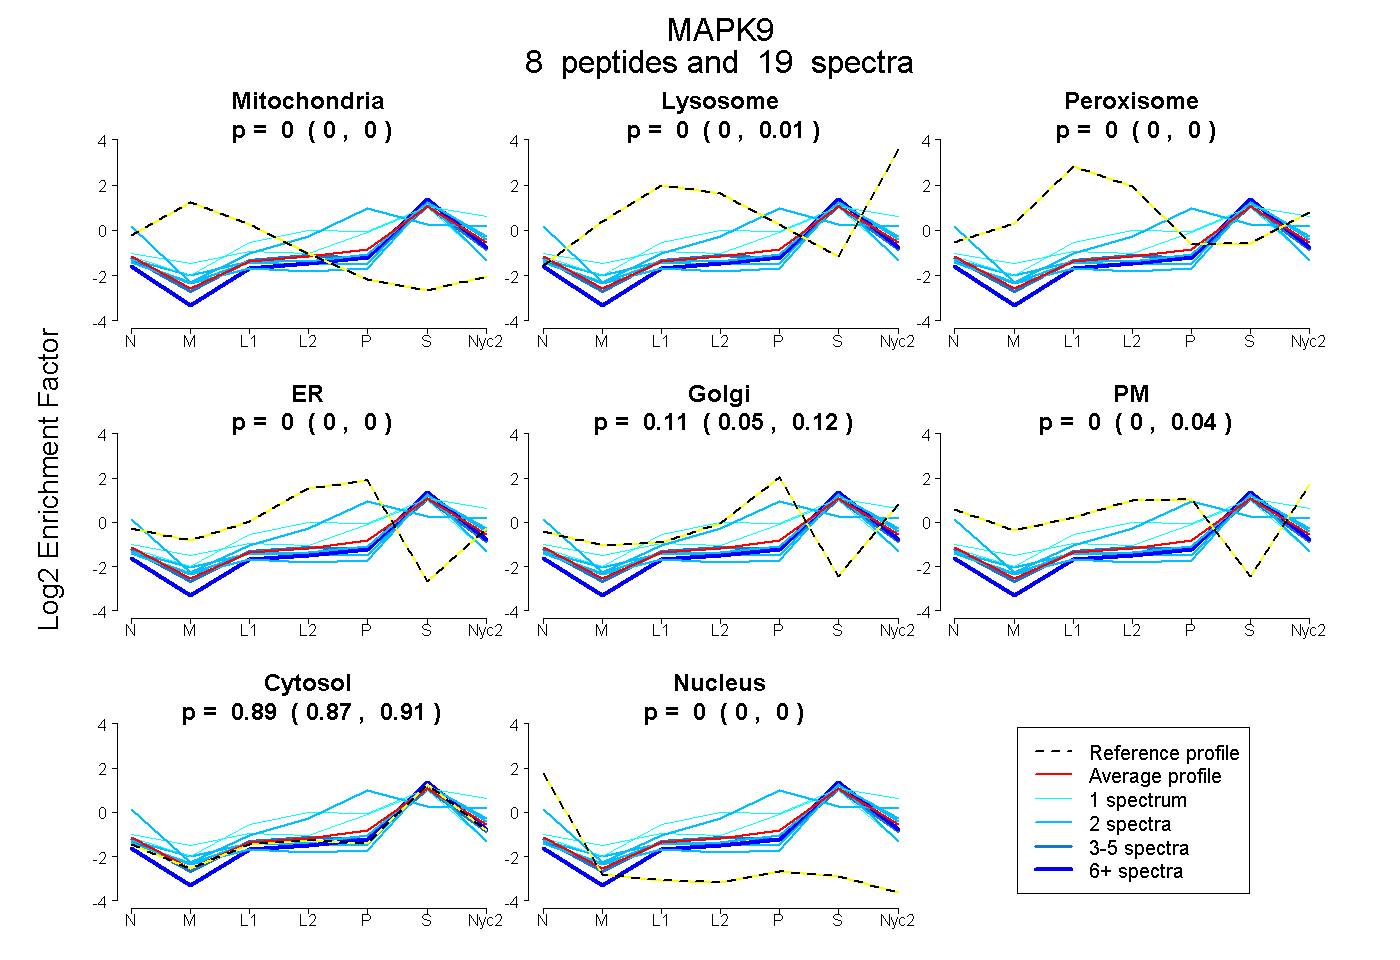 |
0.000
0.000 | 0.000 |
0.000
0.000 | 0.005 |
|
0.000
0.000 | 0.000 |
0.000
0.000 | 0.000 |
0.107
0.052 | 0.122 |
0.000
0.000 | 0.036 |
0.893
0.874 | 0.909 |
0.000
0.000 | 0.000 |
|
| | | Plot |
Mito |
|
Lyso or Perox |
|
ER |
Golgi |
PM |
Cytosol |
Nucleus |
|
| Expt B |
3
peptides |
7
spectra |
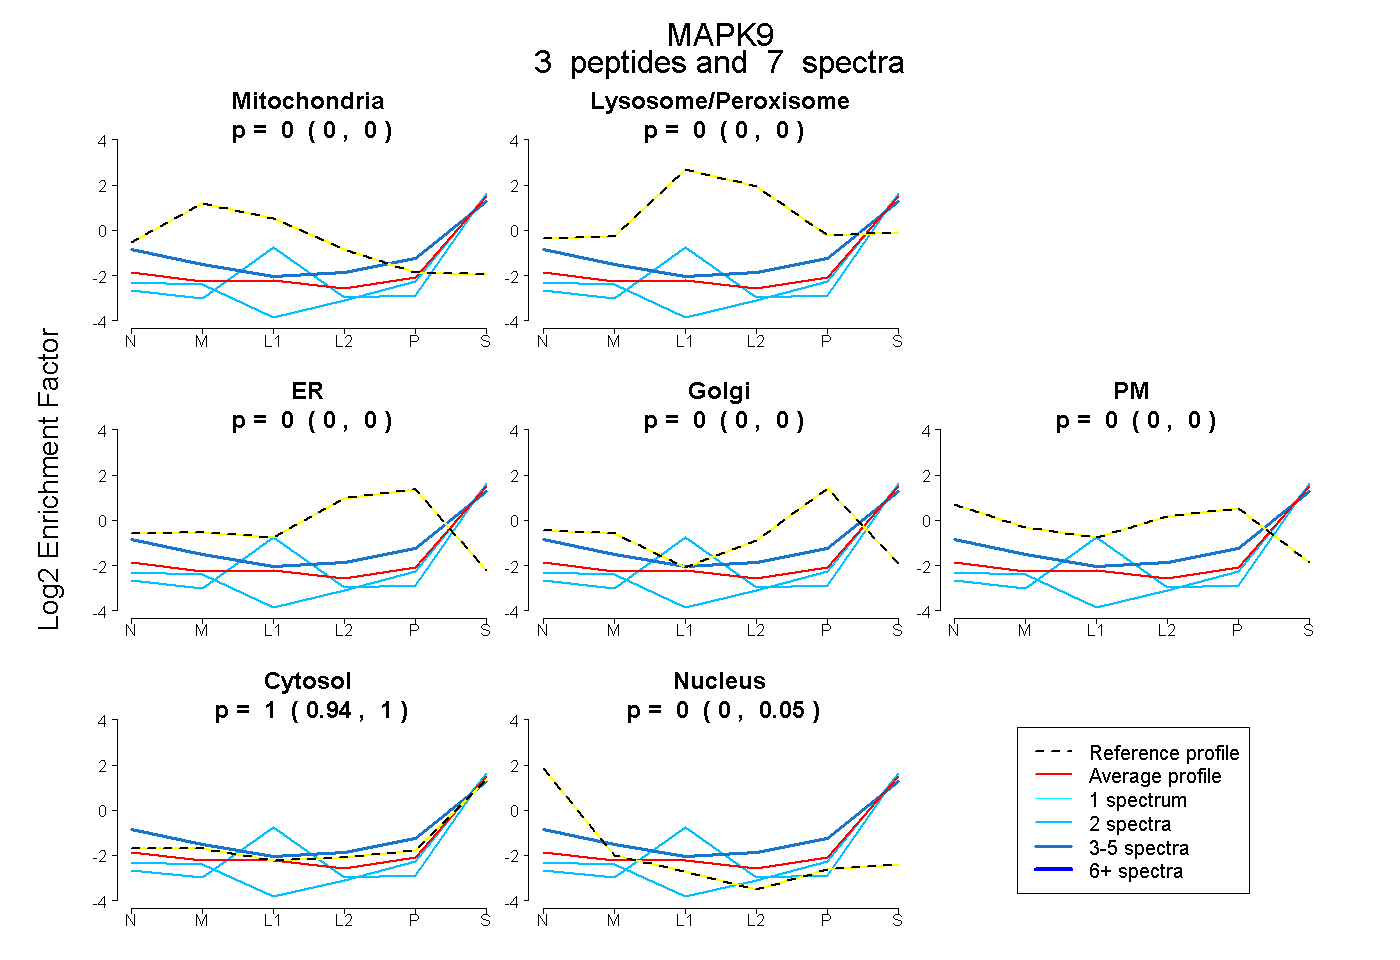 |
0.000
0.000 | 0.000 |
|
0.000
0.000 | 0.000 |
|
0.000
0.000 | 0.000 |
0.000
0.000 | 0.000 |
0.000
0.000 | 0.000 |
0.996
0.938 | 1.000 |
0.004
0.000 | 0.050 |
|
| 2 spectra, LSRPFQNQTHAK |
0.000 |
|
0.000 |
|
0.000 |
0.000 |
0.000 |
1.000 |
0.000 |
|
| 2 spectra, EVMDWEER |
0.000 |
|
0.000 |
|
0.000 |
0.000 |
0.000 |
1.000 |
0.000 |
|
| 3 spectra, NYVENRPK |
0.000 |
|
0.000 |
|
0.000 |
0.000 |
0.142 |
0.839 |
0.019 |
|
| | | Plot |
|
Lyso |
|
|
|
|
|
|
|
Other |
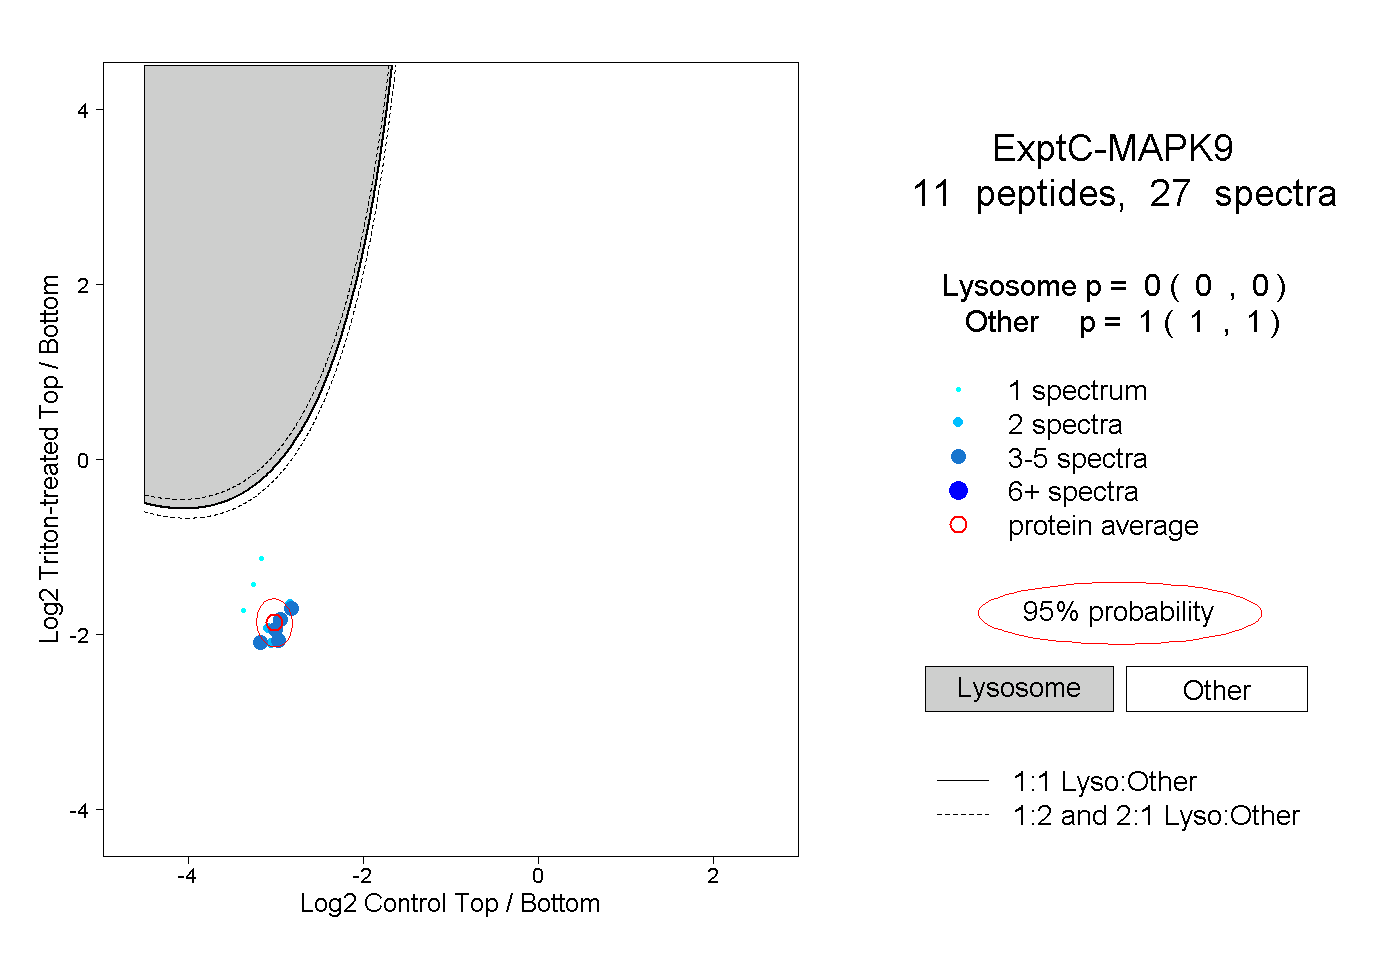
| Expt C |
11
peptides |
27
spectra |
 |
|
0.000
0.000 | 0.000 |
|
|
|
|
|
|
|
1.000
1.000 | 1.000 |
| | | Plot |
|
Lyso |
|
|
|
|
|
|
|
Other |
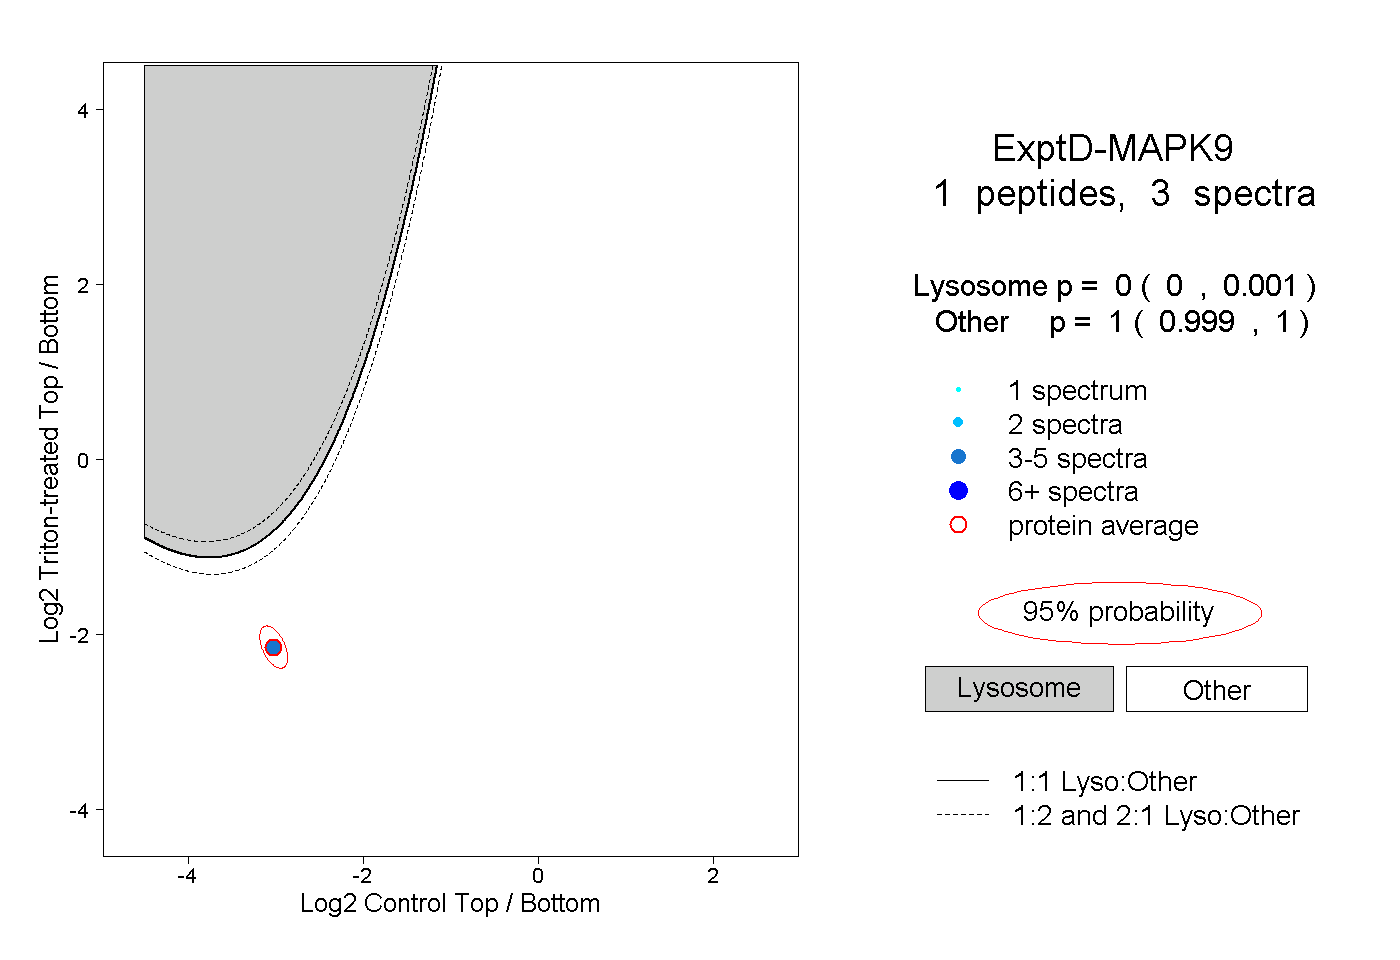
| Expt D |
1
peptide |
3
spectra |
 |
|
0.000
0.000 | 0.001 |
|
|
|
|
|
|
|
1.000
0.999 | 1.000 |