 8
8peptides
spectra
0.000 | 0.000
0.000 | 0.005
0.000 | 0.000
0.000 | 0.000
0.052 | 0.122
0.000 | 0.036
0.874 | 0.909
0.000 | 0.000
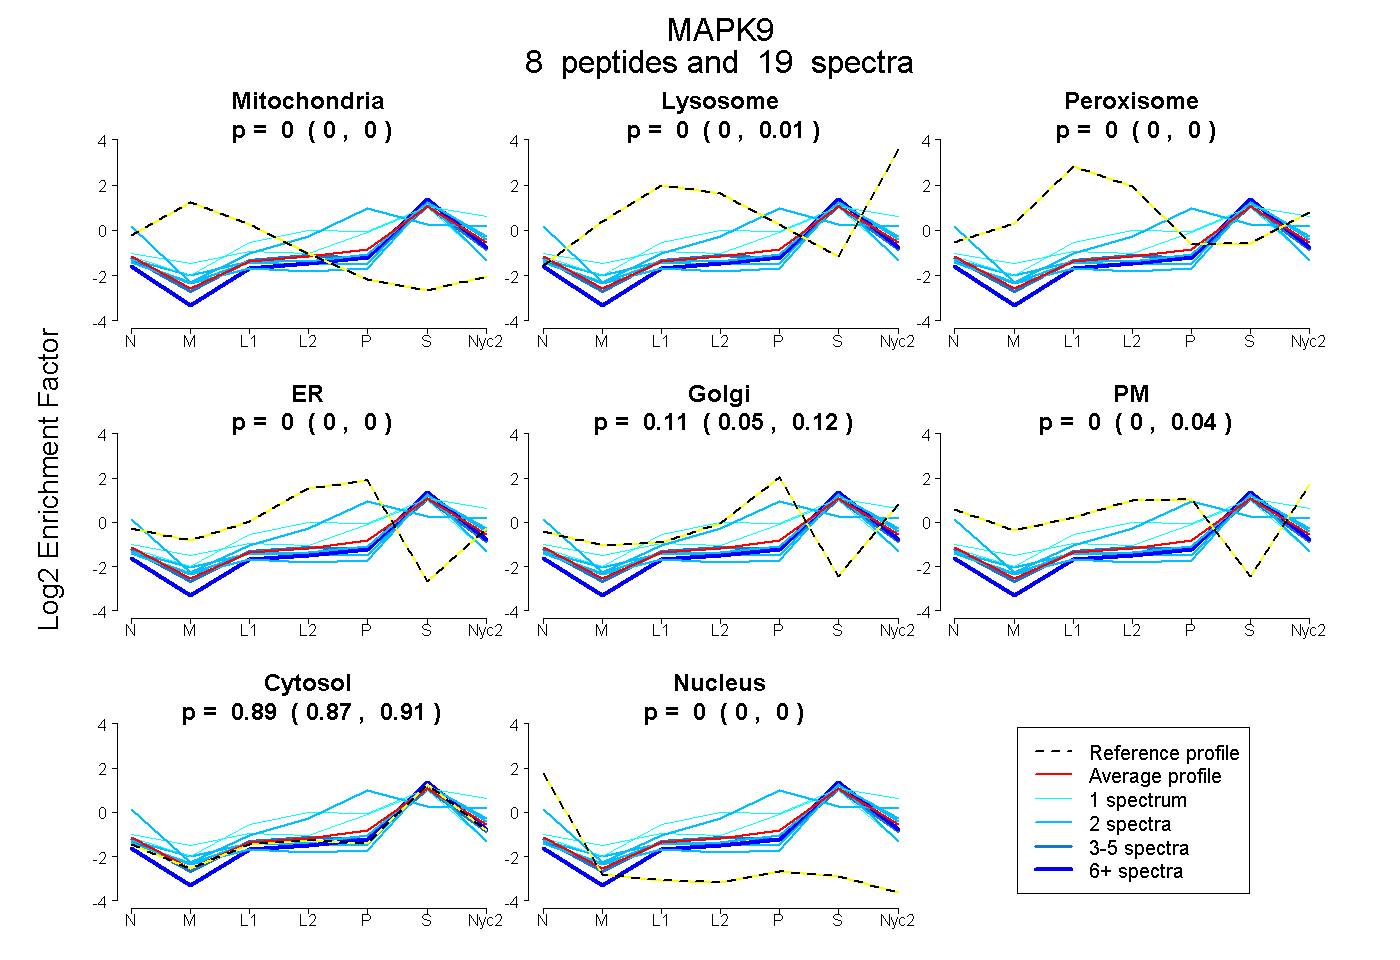
| Plot | Mito | Lyso | Perox | ER | Golgi | PM | Cytosol | Nucleus | |||||
| Expt A |
8 peptides |
19 spectra |
|
0.000 0.000 | 0.000 |
0.000 0.000 | 0.005 |
0.000 0.000 | 0.000 |
0.000 0.000 | 0.000 |
0.107 0.052 | 0.122 |
0.000 0.000 | 0.036 |
0.893 0.874 | 0.909 |
0.000 0.000 | 0.000 |
| 6 spectra, EVMDWEER | 0.000 | 0.000 | 0.000 | 0.000 | 0.000 | 0.000 | 1.000 | 0.000 | ||
| 2 spectra, VLFPGR | 0.000 | 0.000 | 0.000 | 0.006 | 0.350 | 0.143 | 0.500 | 0.000 | ||
| 1 spectrum, ELVLLK | 0.047 | 0.000 | 0.000 | 0.187 | 0.000 | 0.000 | 0.766 | 0.000 | ||
| 1 spectrum, SDGQFYSVQVADSTFTVLK | 0.000 | 0.267 | 0.000 | 0.031 | 0.042 | 0.000 | 0.660 | 0.000 | ||
| 3 spectra, EHAIEEWK | 0.000 | 0.000 | 0.000 | 0.044 | 0.000 | 0.000 | 0.942 | 0.015 | ||
| 2 spectra, APEVILGMGYK | 0.000 | 0.032 | 0.000 | 0.000 | 0.000 | 0.000 | 0.968 | 0.000 | ||
| 2 spectra, ISVDEALR | 0.000 | 0.000 | 0.000 | 0.000 | 0.000 | 0.000 | 0.927 | 0.073 | ||
| 2 spectra, NYVENRPK | 0.000 | 0.064 | 0.000 | 0.000 | 0.029 | 0.000 | 0.907 | 0.000 |
| Plot | Mito | Lyso or Perox | ER | Golgi | PM | Cytosol | Nucleus | ||||||
| Expt B |
3 peptides |
7 spectra |
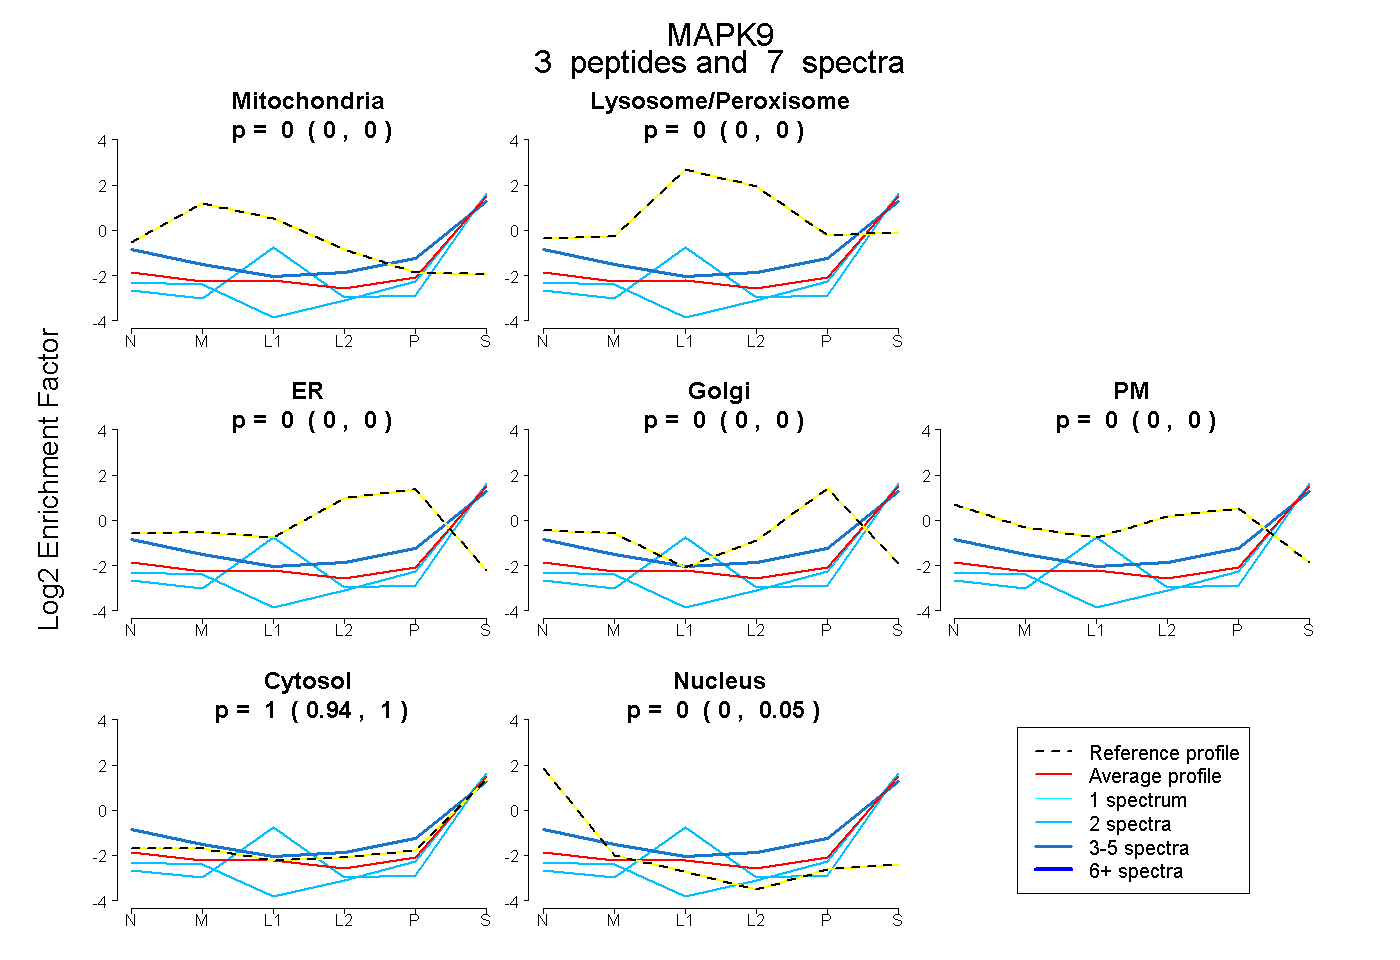 |
0.000 0.000 | 0.000 |
0.000 0.000 | 0.000 |
0.000 0.000 | 0.000 |
0.000 0.000 | 0.000 |
0.000 0.000 | 0.000 |
0.996 0.938 | 1.000 |
0.004 0.000 | 0.050 |
|||
| Plot | Lyso | Other | |||||||||||
| Expt C |
11 peptides |
27 spectra |
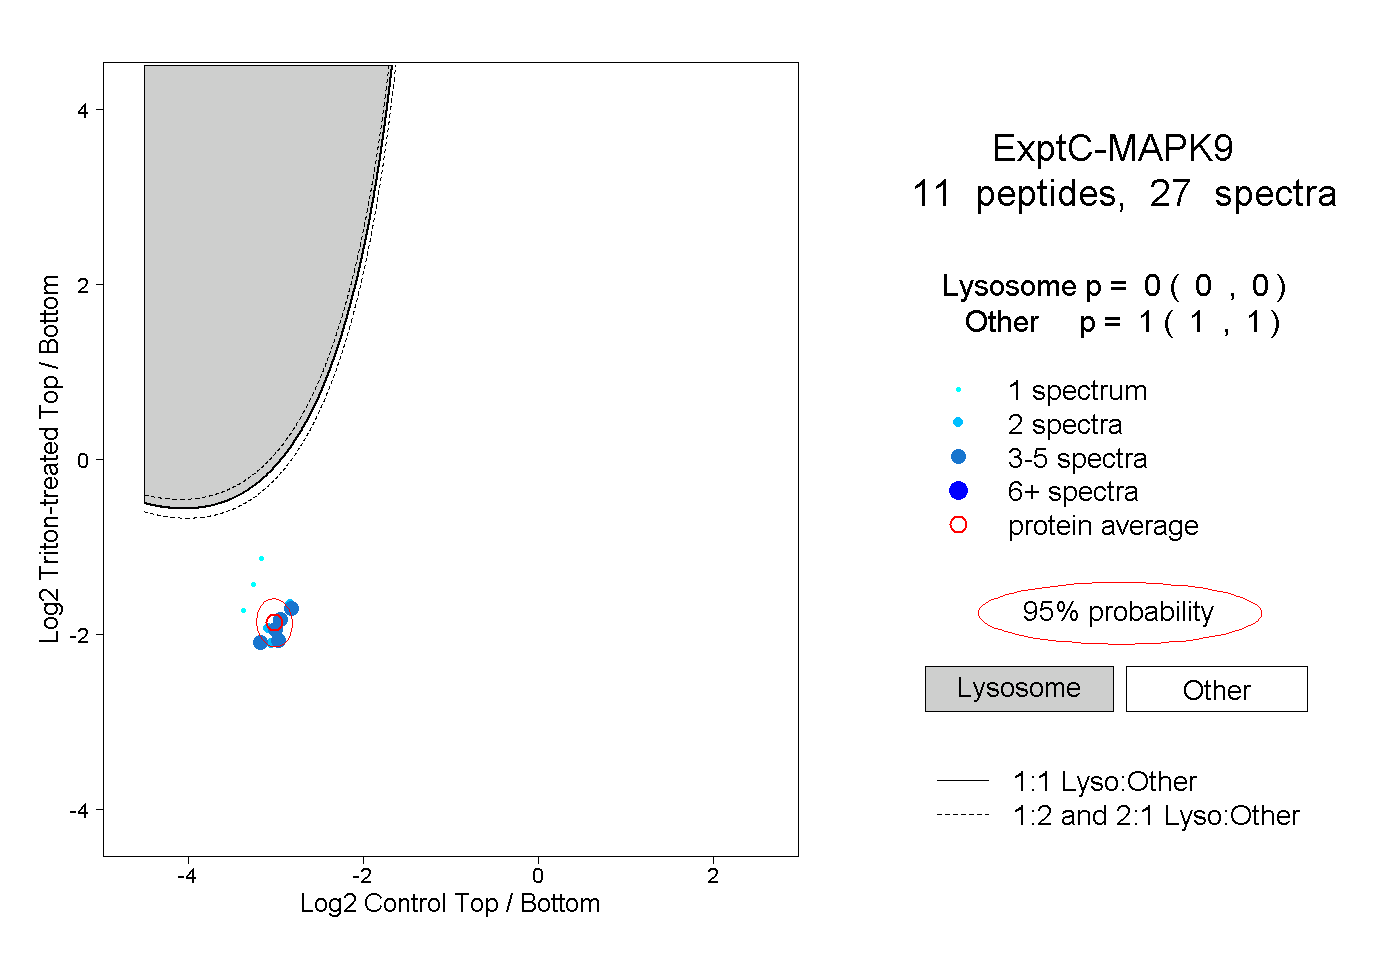 |
0.000 0.000 | 0.000 |
1.000 1.000 | 1.000 |
||||||||
| Plot | Lyso | Other | |||||||||||
| Expt D |
1 peptide |
3 spectra |
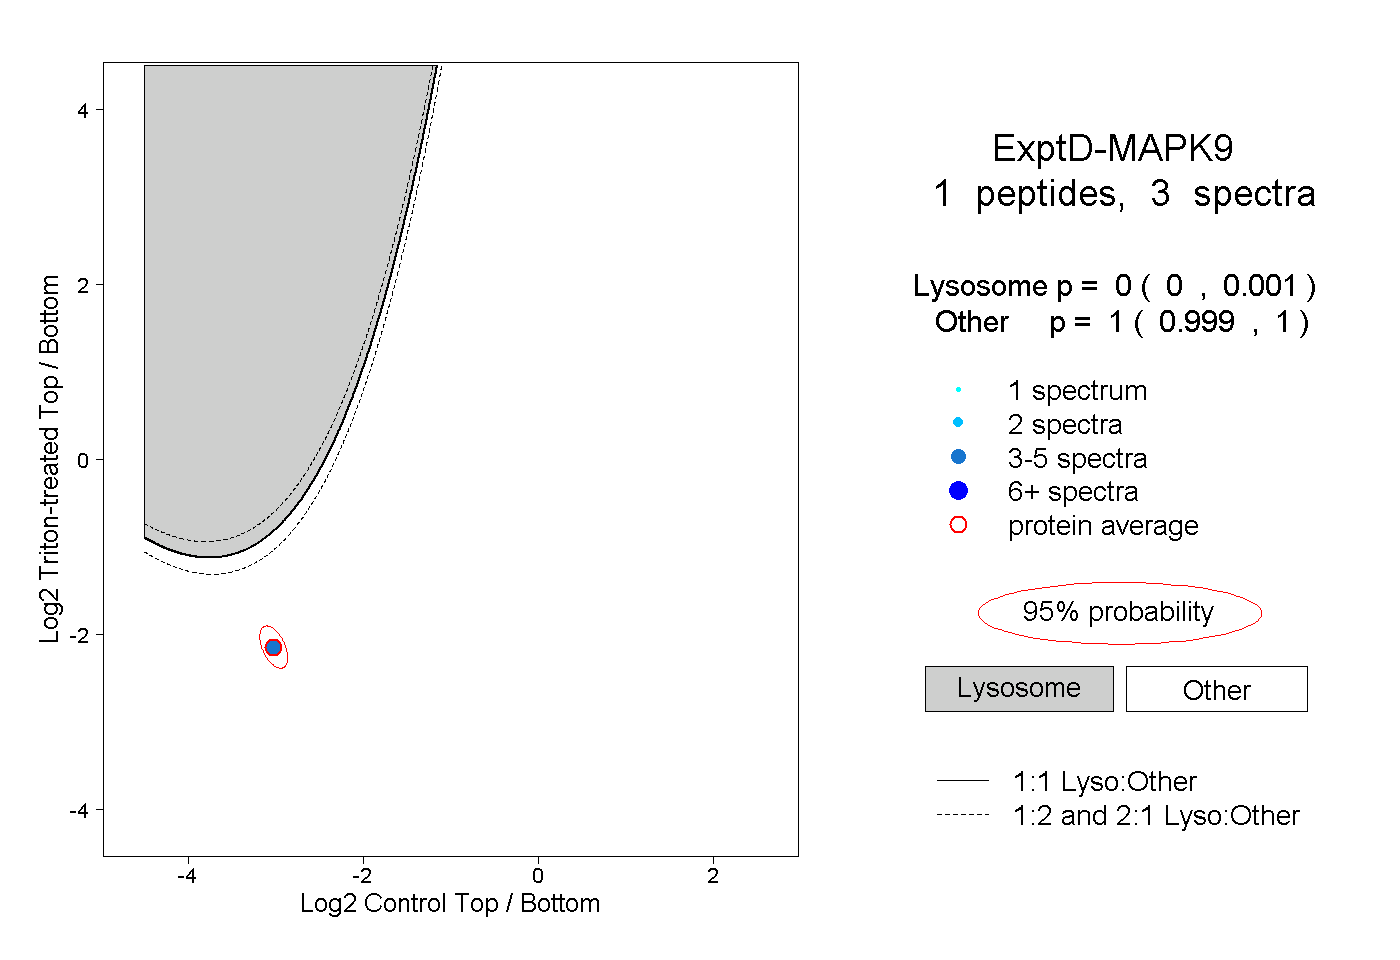 |
0.000 0.000 | 0.001 |
1.000 0.999 | 1.000 |