 12
12peptides
spectra
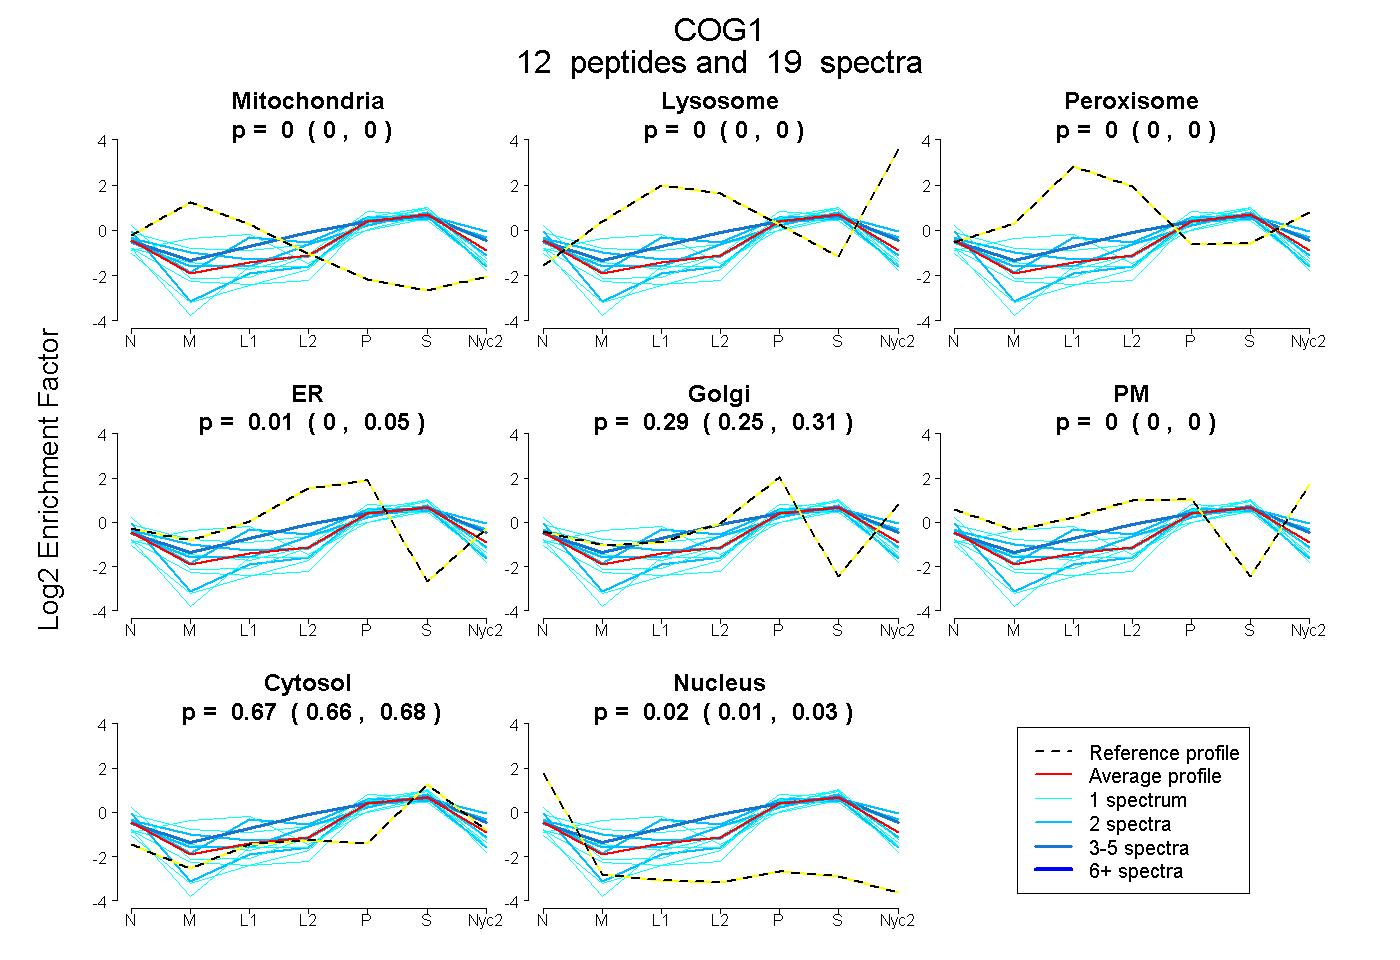
0.000 | 0.000
0.000 | 0.000
0.000 | 0.000
0.000 | 0.047
0.250 | 0.310
0.000 | 0.000
0.662 | 0.676
0.015 | 0.032
4peptides
spectra
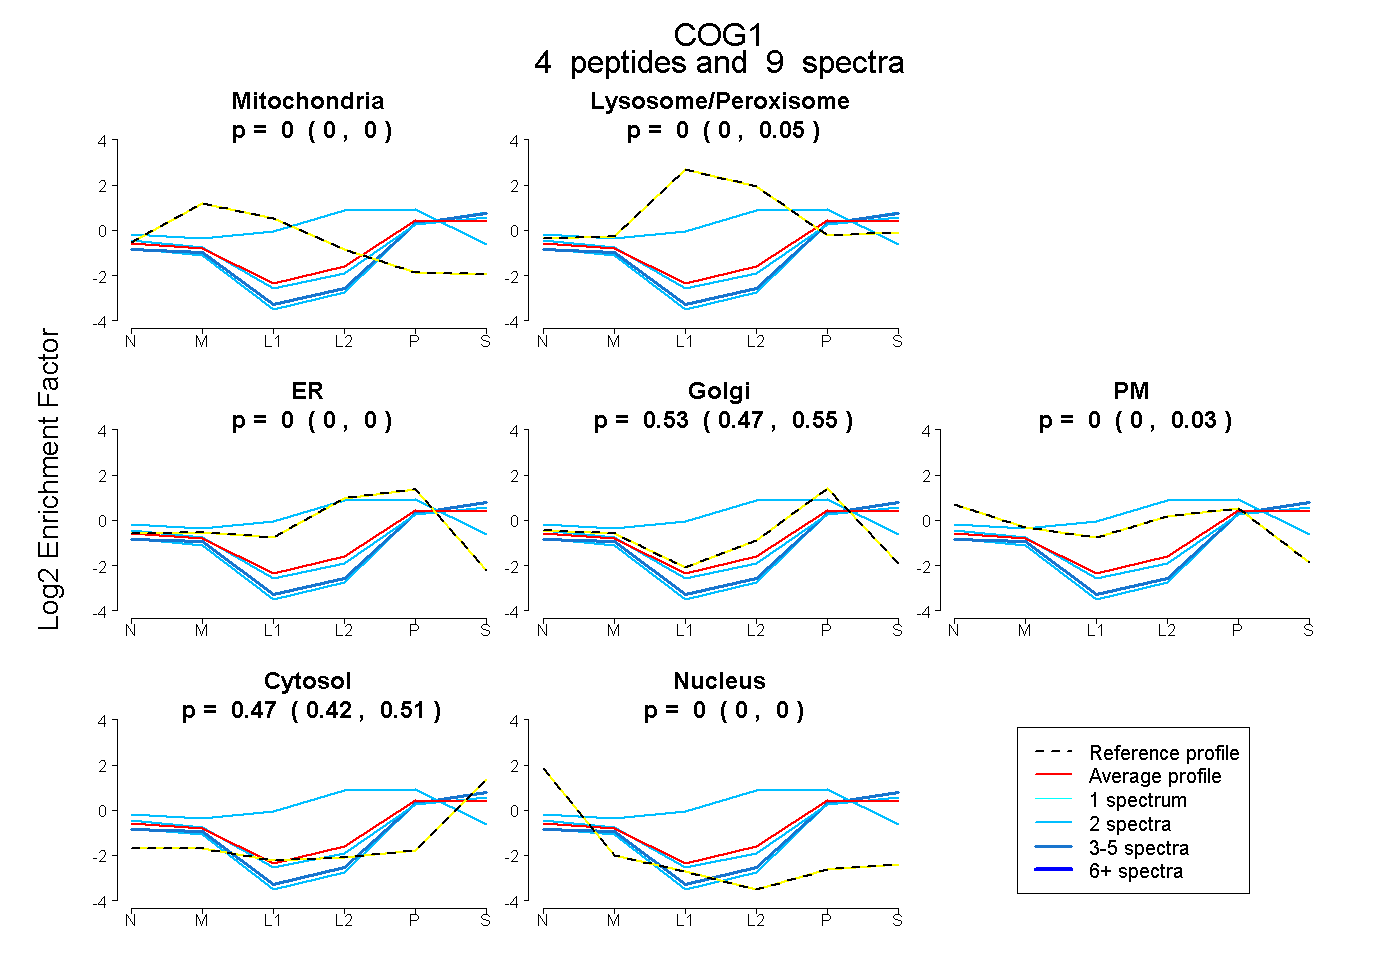
0.000 | 0.000
0.000 | 0.051
0.000 | 0.000
0.472 | 0.553
0.000 | 0.031
0.422 | 0.506
0.000 | 0.000
4peptides
spectra
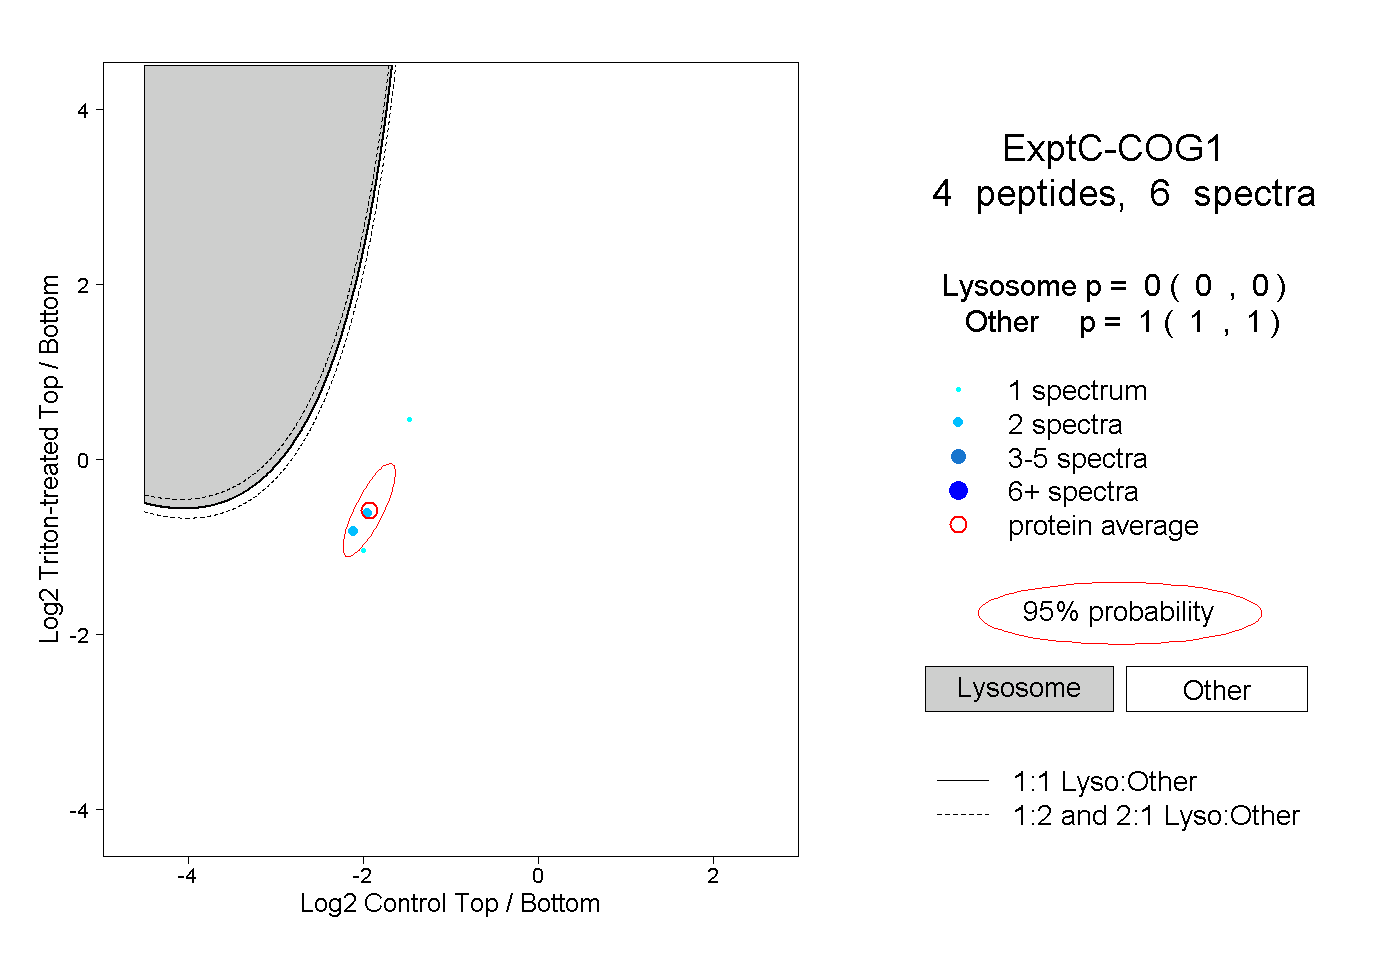
0.000 | 0.000
1.000 | 1.000