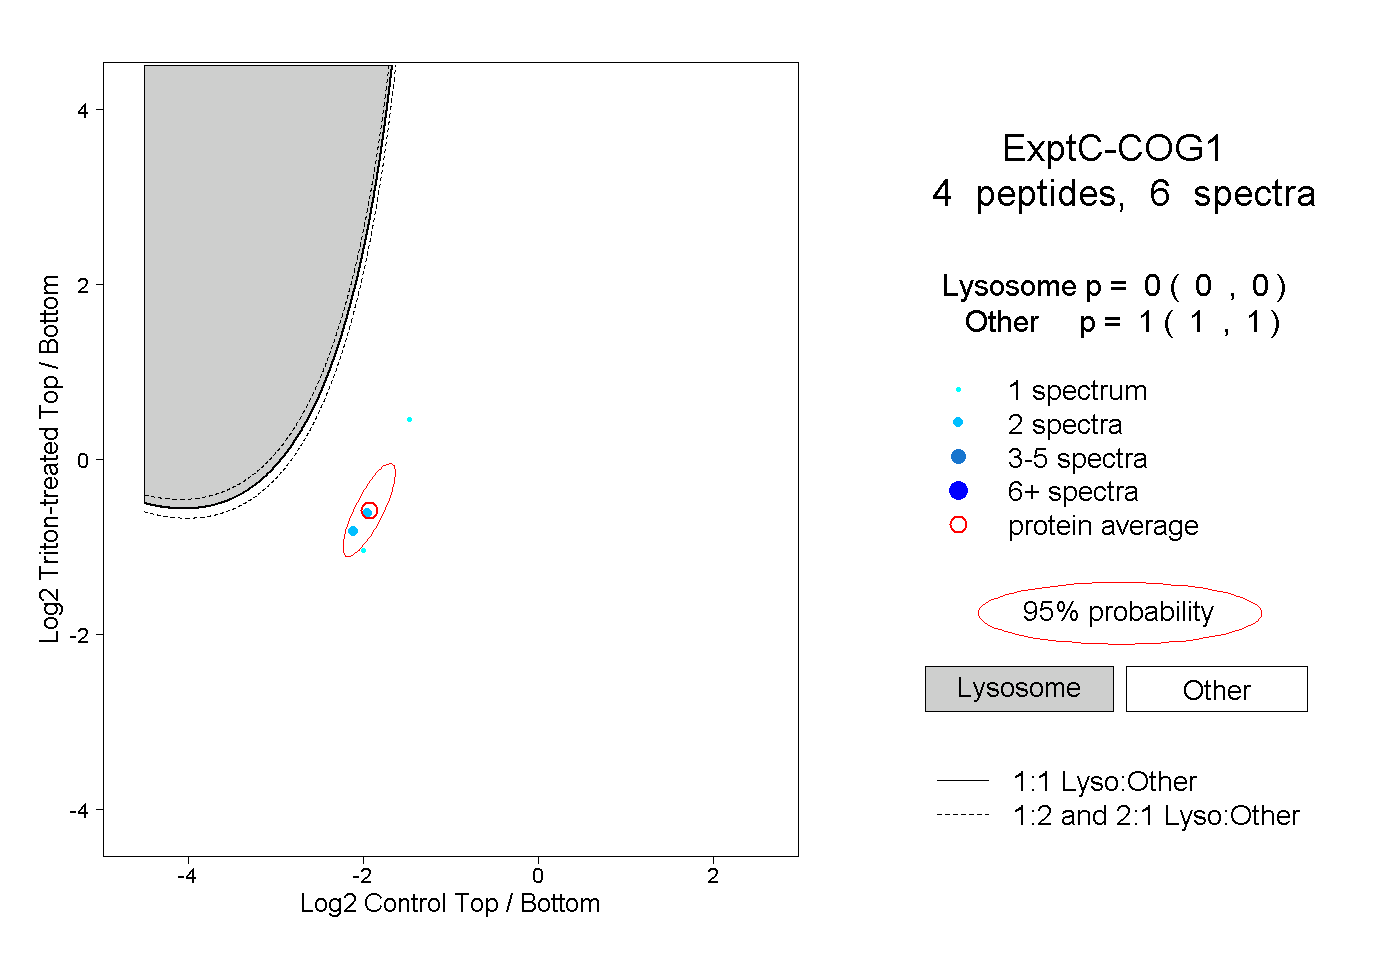
COG1
[ENSRNOP00000003804]
Main page
| | | Plot |
Mito |
Lyso |
|
Perox |
ER |
Golgi |
PM |
Cytosol |
Nucleus |
|
| Expt A |
 12
12
peptides |
19
spectra |
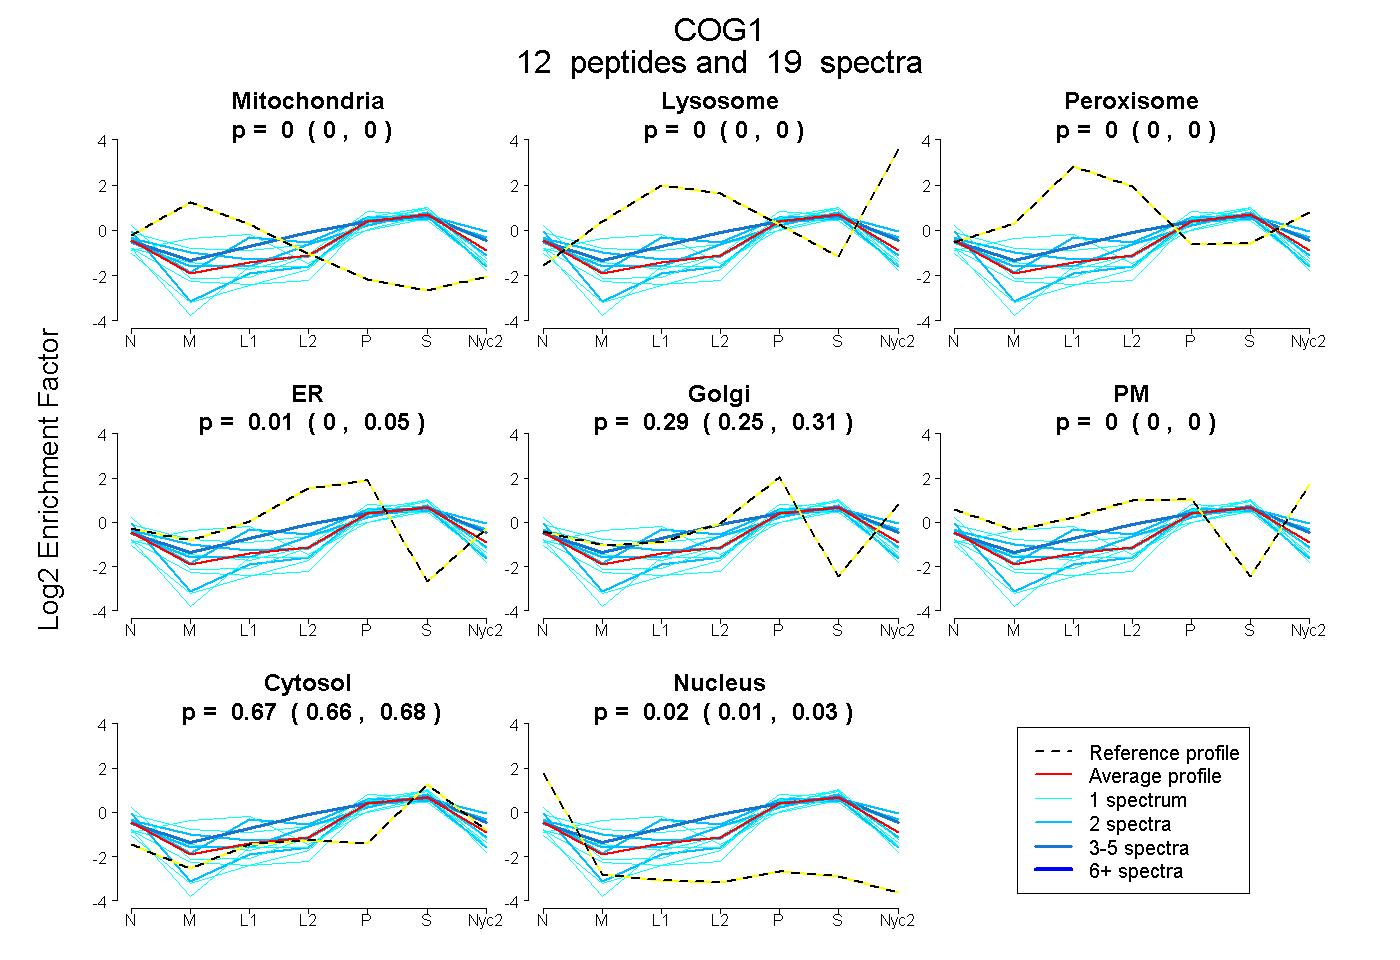 |
0.000
0.000 | 0.000 |
0.000
0.000 | 0.000 |
|
0.000
0.000 | 0.000 |
0.015
0.000 | 0.047 |
0.291
0.250 | 0.310 |
0.000
0.000 | 0.000 |
0.670
0.662 | 0.676 |
0.025
0.015 | 0.032 |
|
| | | Plot |
Mito |
|
Lyso or Perox |
|
ER |
Golgi |
PM |
Cytosol |
Nucleus |
|
| Expt B |
4
peptides |
9
spectra |
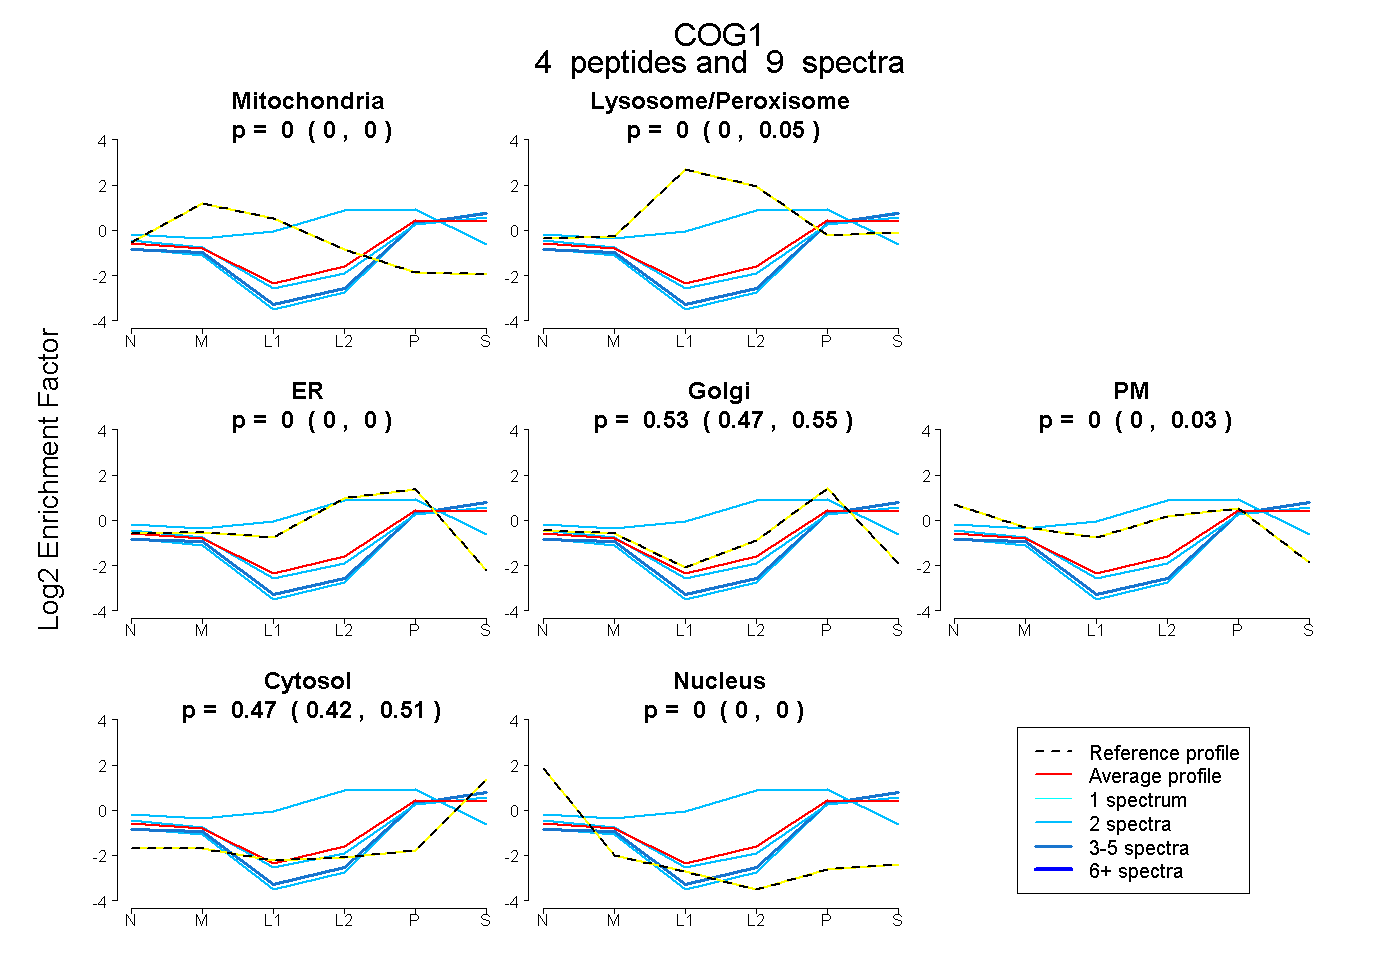 |
0.000
0.000 | 0.000 |
|
0.000
0.000 | 0.051 |
|
0.000
0.000 | 0.000 |
0.528
0.472 | 0.553 |
0.000
0.000 | 0.031 |
0.472
0.422 | 0.506 |
0.000
0.000 | 0.000 |
|
| 2 spectra, QVAAASHFR |
0.000 |
|
0.445 |
|
0.111 |
0.423 |
0.009 |
0.013 |
0.000 |
|
| 3 spectra, FPILVR |
0.000 |
|
0.000 |
|
0.000 |
0.386 |
0.000 |
0.614 |
0.000 |
|
| 2 spectra, QALTDFLLAR |
0.000 |
|
0.000 |
|
0.000 |
0.472 |
0.000 |
0.528 |
0.000 |
|
| 2 spectra, ALQLLYDLR |
0.000 |
|
0.000 |
|
0.000 |
0.359 |
0.000 |
0.614 |
0.026 |
|
| | | Plot |
|
Lyso |
|
|
|
|
|
|
|
Other |
| Expt C |
4
peptides |
6
spectra |
 |
|
0.000
0.000 | 0.000 |
|
|
|
|
|
|
|
1.000
1.000 | 1.000 |