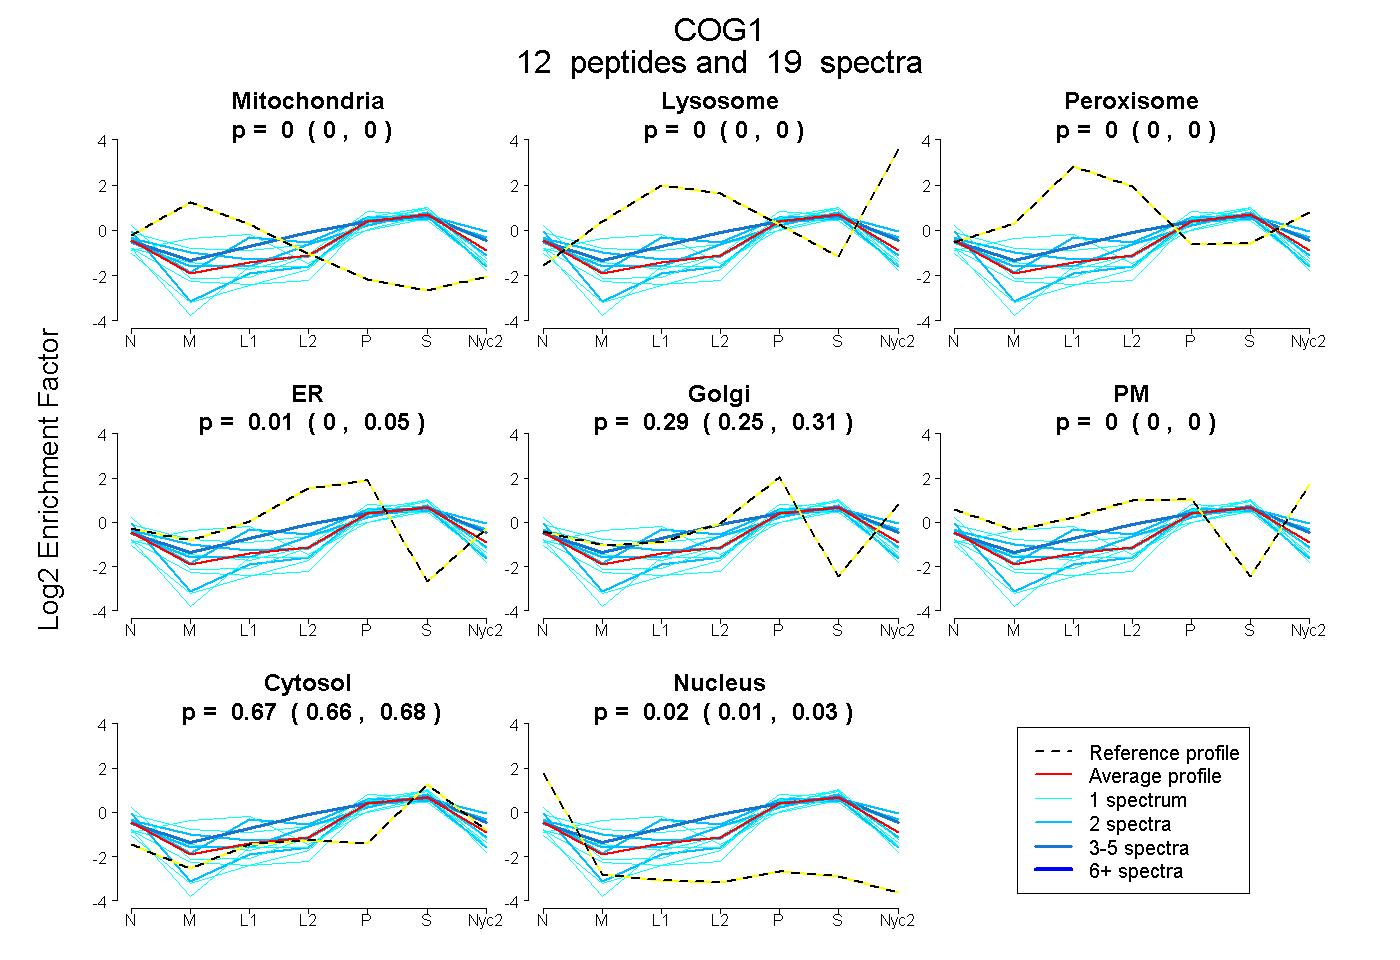
 12
12peptides
spectra
0.000 | 0.000
0.000 | 0.000
0.000 | 0.000
0.000 | 0.047
0.250 | 0.310
0.000 | 0.000
0.662 | 0.676
0.015 | 0.032
| Plot | Mito | Lyso | Perox | ER | Golgi | PM | Cytosol | Nucleus | |||||
| Expt A |
12 peptides |
19 spectra |
|
0.000 0.000 | 0.000 |
0.000 0.000 | 0.000 |
0.000 0.000 | 0.000 |
0.015 0.000 | 0.047 |
0.291 0.250 | 0.310 |
0.000 0.000 | 0.000 |
0.670 0.662 | 0.676 |
0.025 0.015 | 0.032 |
| 2 spectra, FGLLPLSMTSTR | 0.000 | 0.000 | 0.000 | 0.000 | 0.193 | 0.000 | 0.639 | 0.168 | ||
| 1 spectrum, CGGSEKPAR | 0.000 | 0.000 | 0.000 | 0.000 | 0.362 | 0.000 | 0.638 | 0.000 | ||
| 1 spectrum, APQPHPPSEK | 0.086 | 0.000 | 0.046 | 0.000 | 0.105 | 0.197 | 0.565 | 0.000 | ||
| 4 spectra, QVAAASHFR | 0.000 | 0.000 | 0.109 | 0.211 | 0.110 | 0.000 | 0.571 | 0.000 | ||
| 1 spectrum, ITLQEMLK | 0.231 | 0.000 | 0.093 | 0.000 | 0.124 | 0.000 | 0.551 | 0.000 | ||
| 2 spectra, DTTHTHQAK | 0.000 | 0.000 | 0.153 | 0.000 | 0.314 | 0.000 | 0.533 | 0.000 | ||
| 1 spectrum, FPILVR | 0.000 | 0.000 | 0.000 | 0.000 | 0.131 | 0.000 | 0.783 | 0.086 | ||
| 1 spectrum, VIEEVTQDQK | 0.000 | 0.000 | 0.000 | 0.000 | 0.121 | 0.000 | 0.822 | 0.057 | ||
| 1 spectrum, QALTDFLLAR | 0.000 | 0.000 | 0.000 | 0.043 | 0.243 | 0.000 | 0.551 | 0.163 | ||
| 2 spectra, LHAVLFMAR | 0.000 | 0.000 | 0.000 | 0.210 | 0.076 | 0.000 | 0.699 | 0.015 | ||
| 2 spectra, HLPASVTEFQPALR | 0.040 | 0.000 | 0.000 | 0.000 | 0.349 | 0.025 | 0.587 | 0.000 | ||
| 1 spectrum, AEIEHK | 0.000 | 0.000 | 0.000 | 0.000 | 0.131 | 0.000 | 0.725 | 0.144 |
| Plot | Mito | Lyso or Perox | ER | Golgi | PM | Cytosol | Nucleus | ||||||
| Expt B |
4 peptides |
9 spectra |
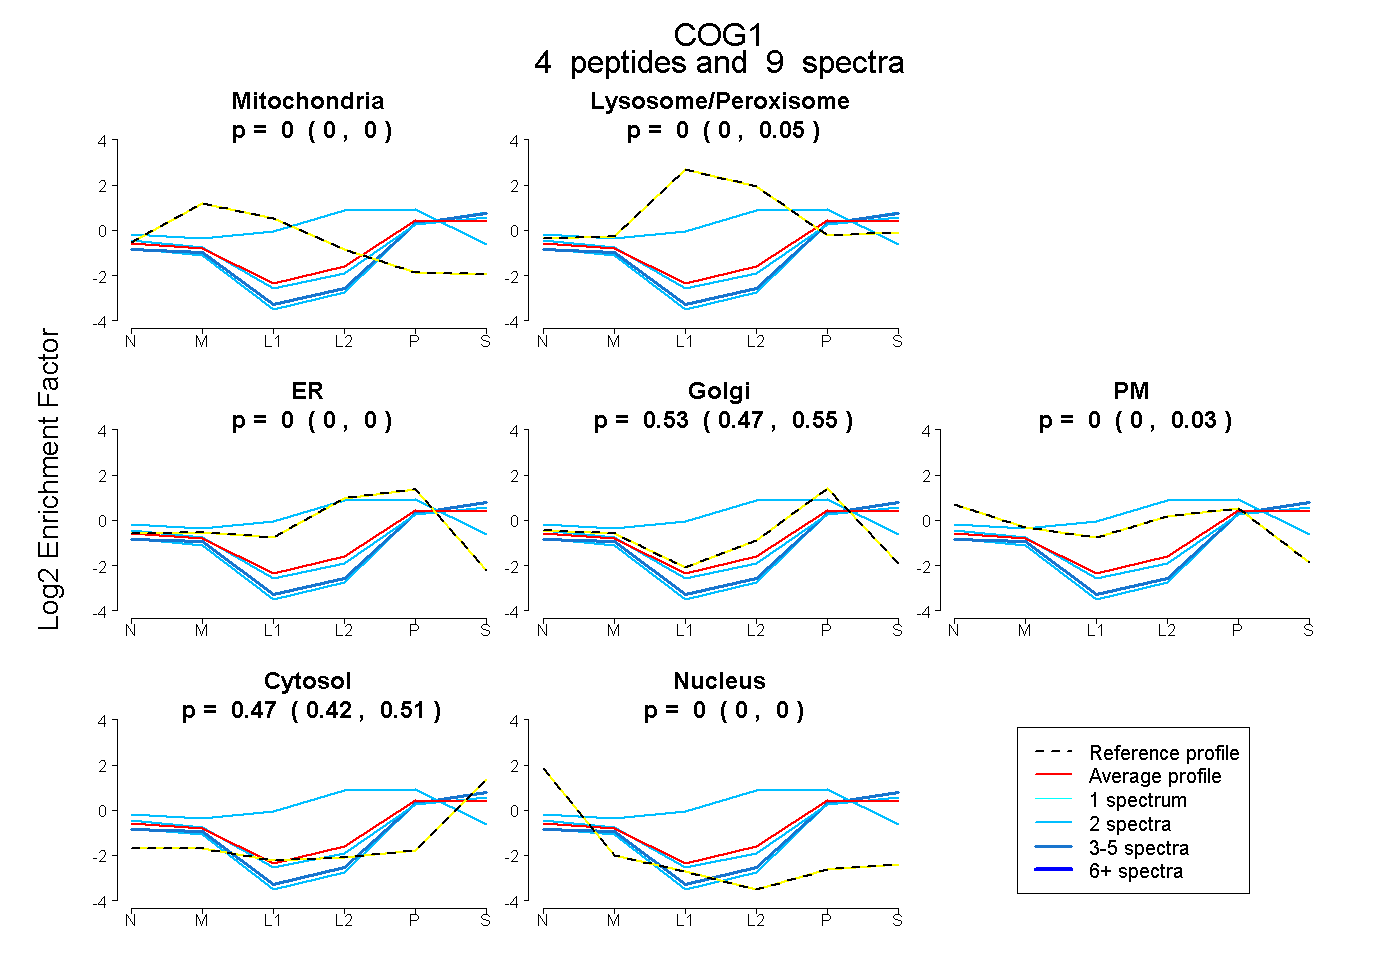 |
0.000 0.000 | 0.000 |
0.000 0.000 | 0.051 |
0.000 0.000 | 0.000 |
0.528 0.472 | 0.553 |
0.000 0.000 | 0.031 |
0.472 0.422 | 0.506 |
0.000 0.000 | 0.000 |
|||
| Plot | Lyso | Other | |||||||||||
| Expt C |
4 peptides |
6 spectra |
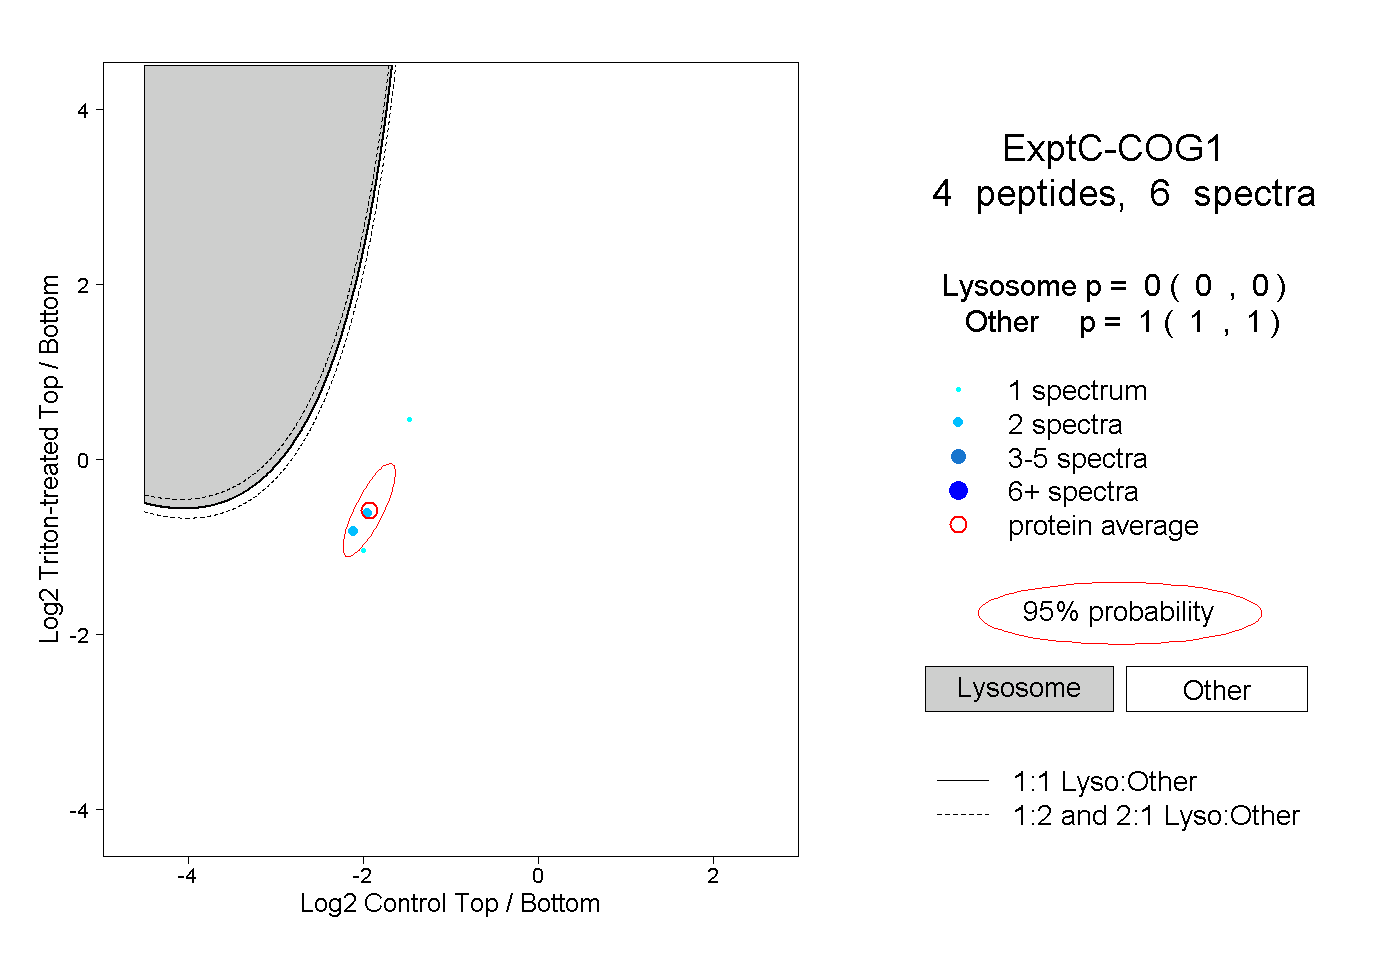 |
0.000 0.000 | 0.000 |
1.000 1.000 | 1.000 |