 19
19peptides
spectra
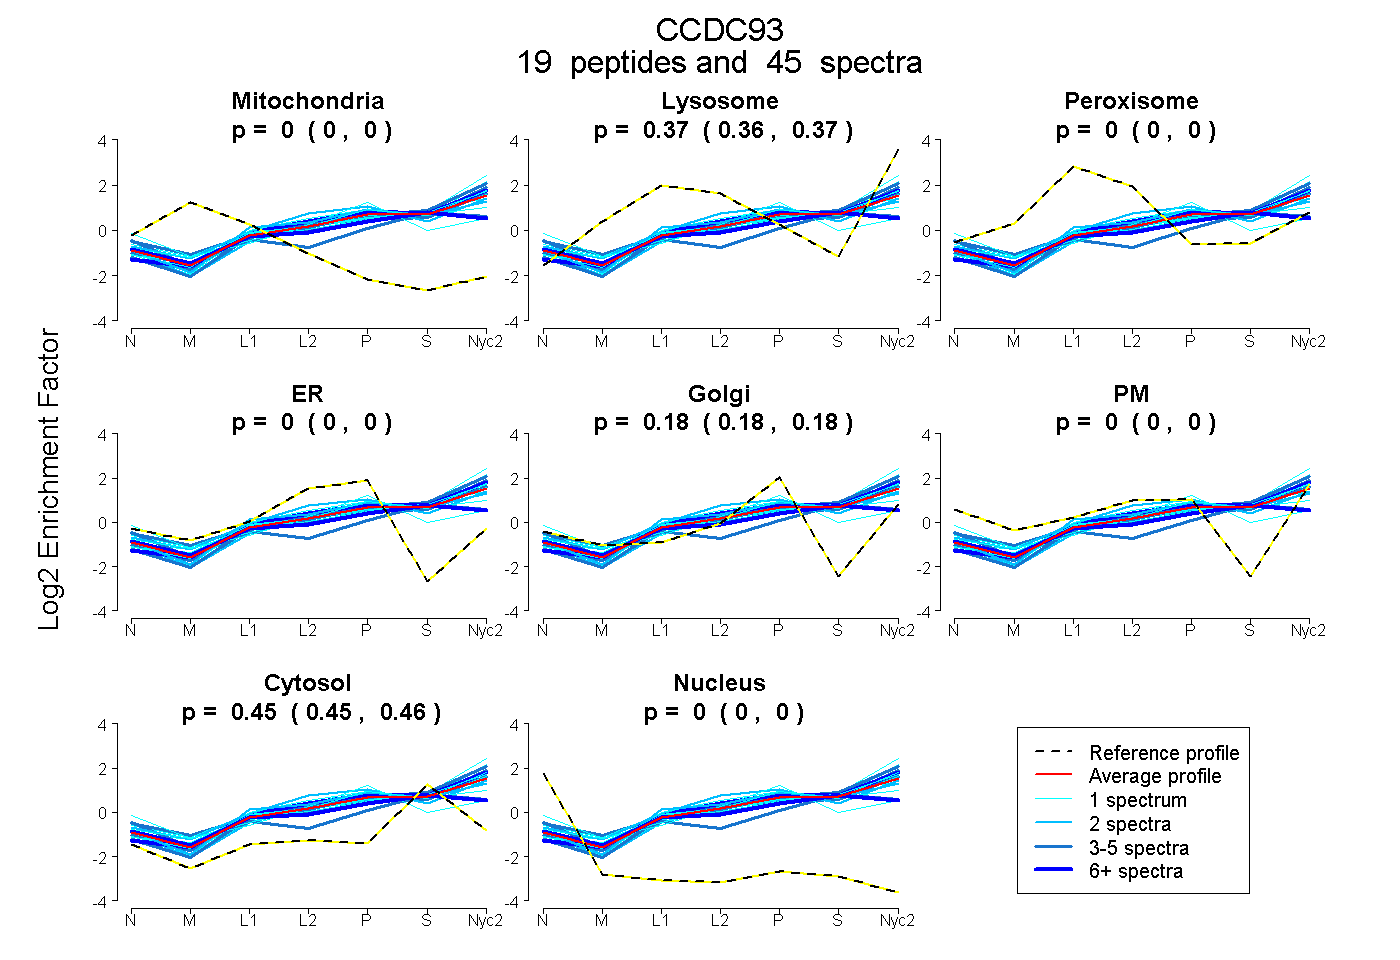
0.000 | 0.000
0.361 | 0.370
0.000 | 0.000
0.000 | 0.000
0.175 | 0.184
0.000 | 0.000
0.451 | 0.457
0.000 | 0.000
7peptides
spectra
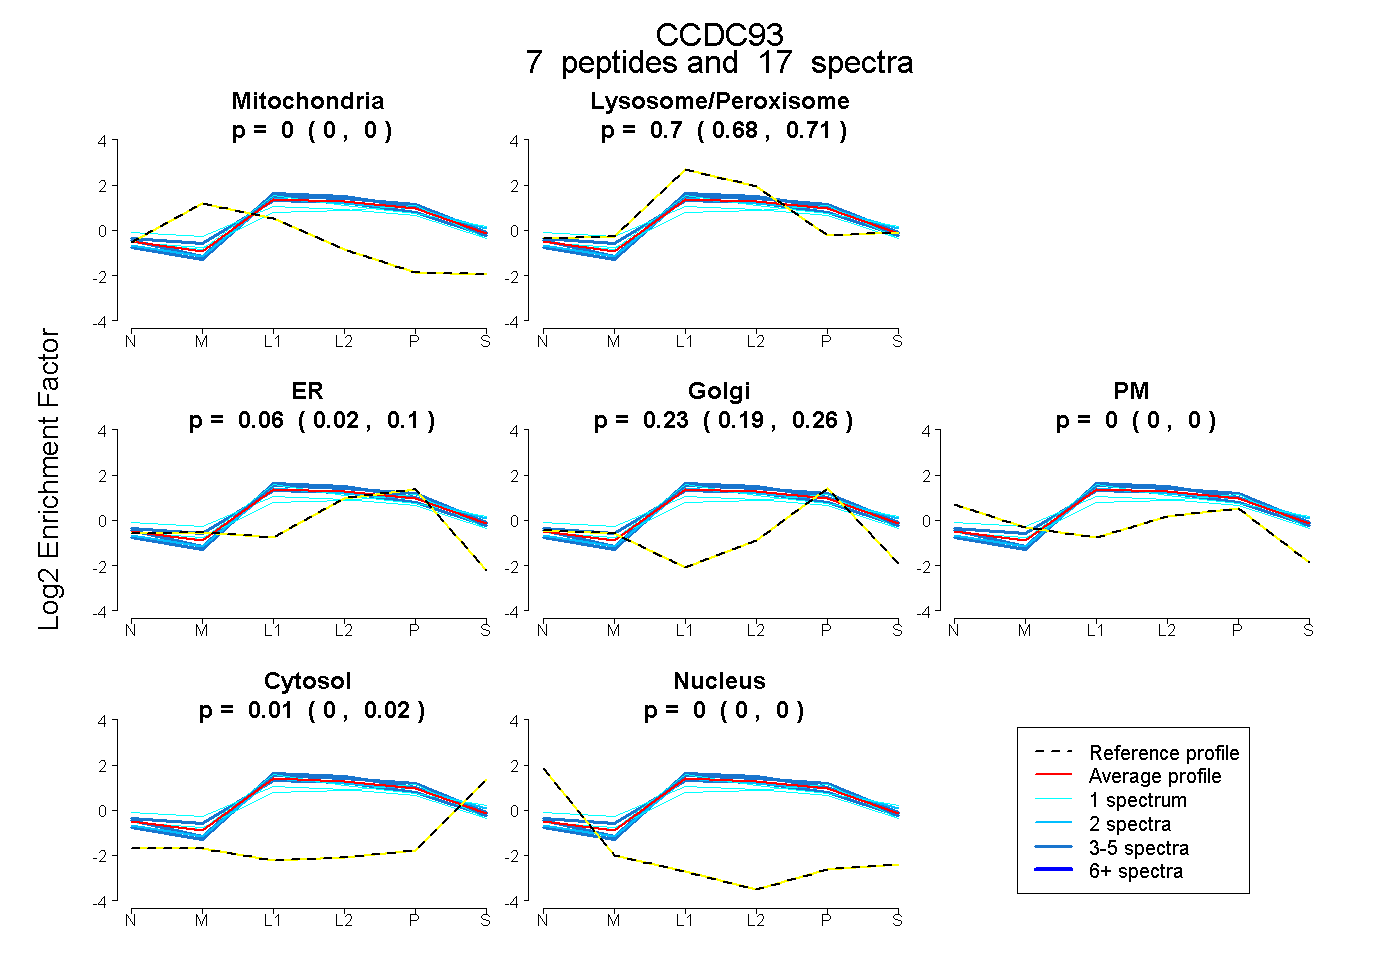
0.000 | 0.000
0.679 | 0.710
0.023 | 0.100
0.189 | 0.260
0.000 | 0.000
0.000 | 0.022
0.000 | 0.000
26peptides
spectra

0.342 | 0.999
0.001 | 0.648
5peptides
spectra
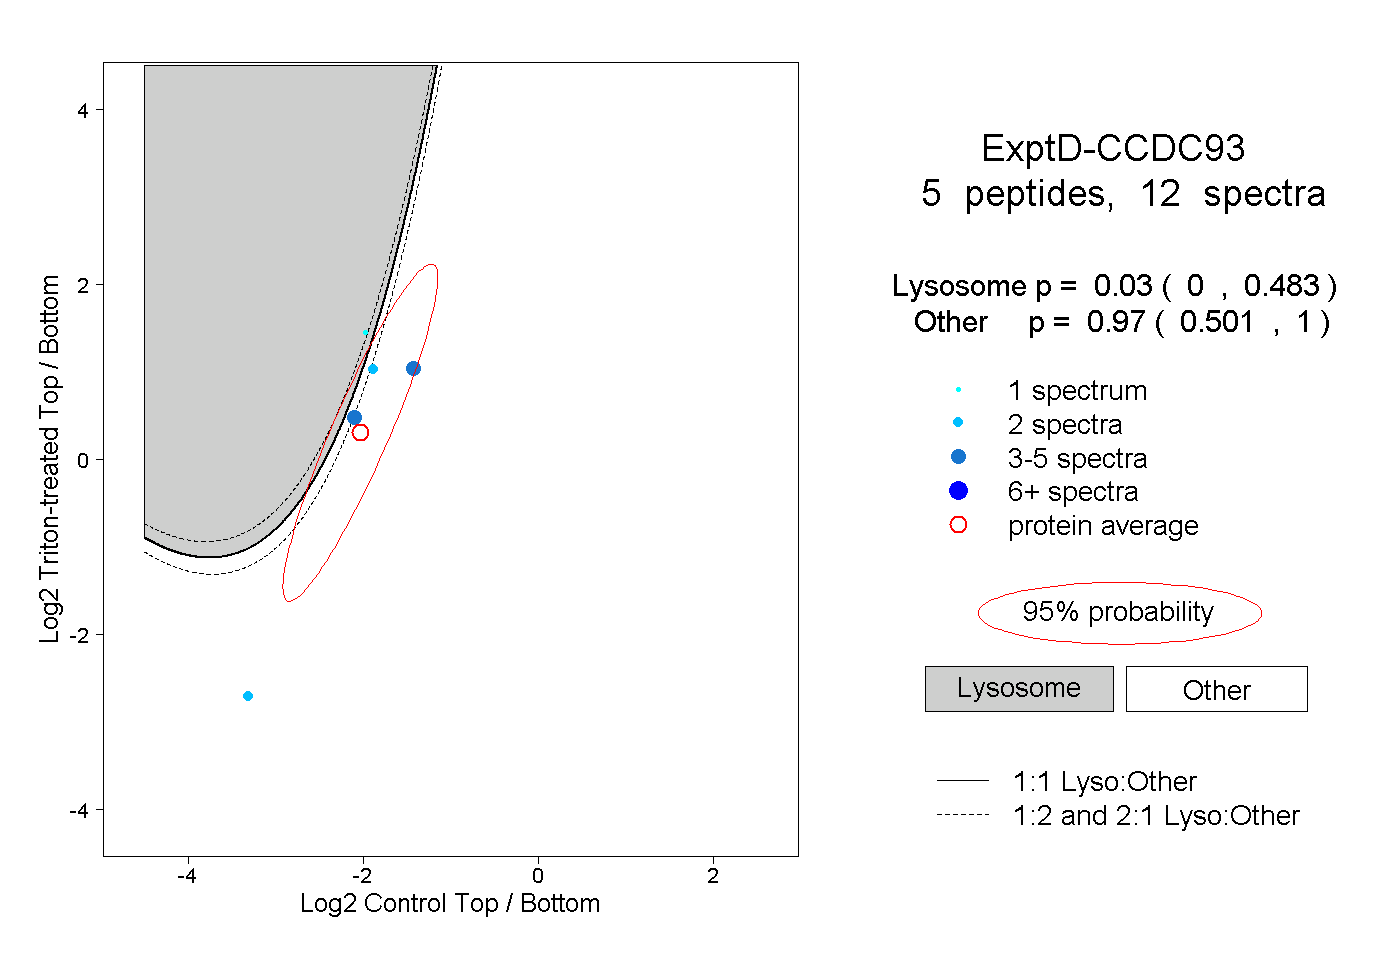
0.000 | 0.483
0.501 | 1.000