CCDC93
[ENSRNOP00000003435]
Main page
| | | Plot |
Mito |
Lyso |
|
Perox |
ER |
Golgi |
PM |
Cytosol |
Nucleus |
|
| Expt A |
 19
19
peptides |
45
spectra |
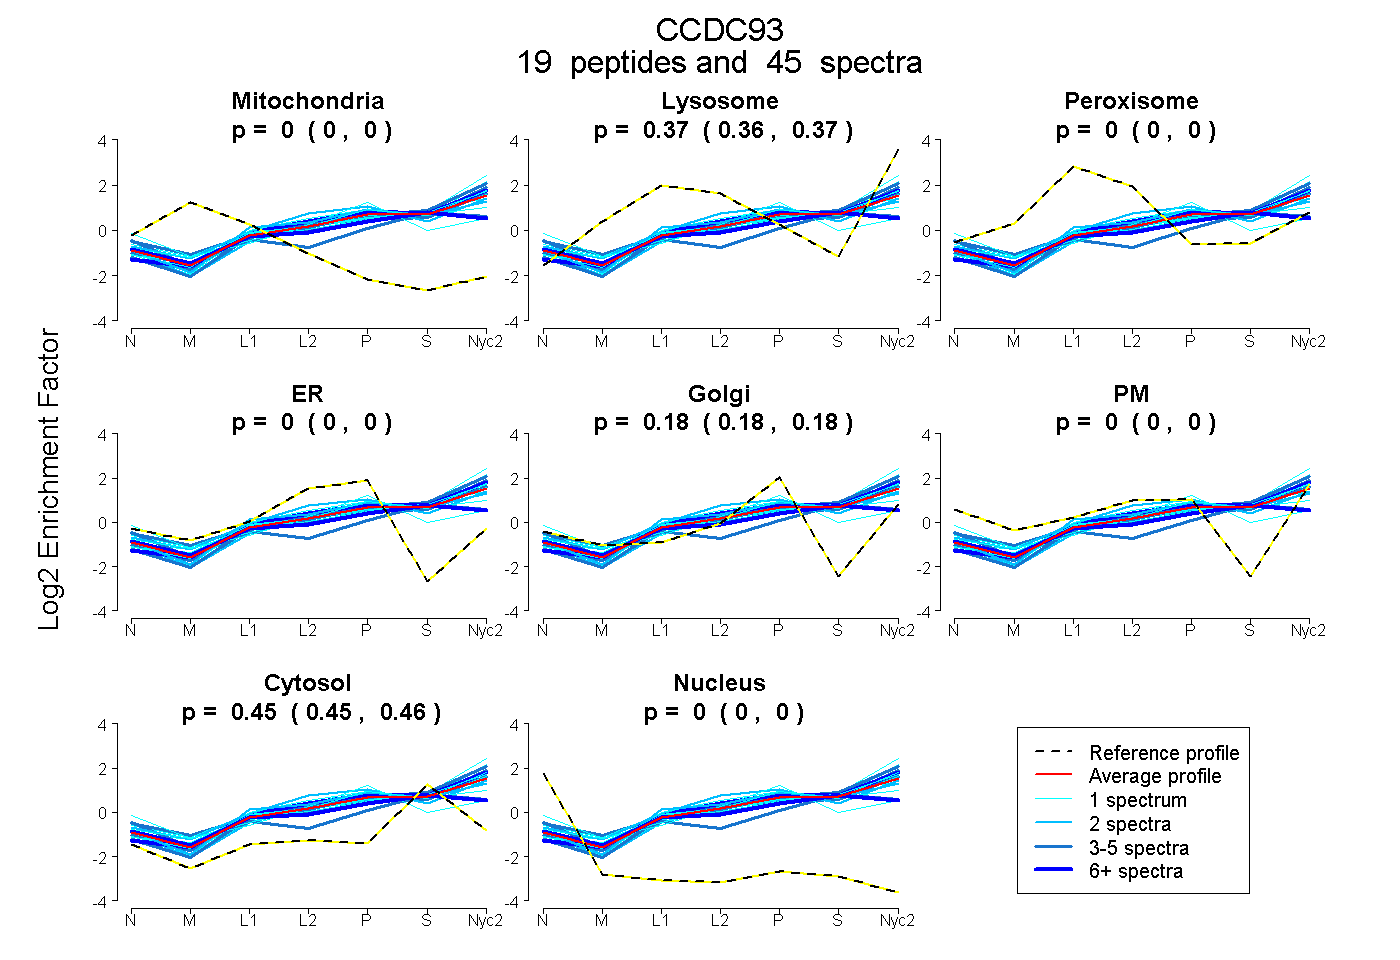 |
0.000
0.000 | 0.000 |
0.366
0.361 | 0.370 |
|
0.000
0.000 | 0.000 |
0.000
0.000 | 0.000 |
0.180
0.175 | 0.184 |
0.000
0.000 | 0.000 |
0.454
0.451 | 0.457 |
0.000
0.000 | 0.000 |
|
| | | Plot |
Mito |
|
Lyso or Perox |
|
ER |
Golgi |
PM |
Cytosol |
Nucleus |
|
| Expt B |
7
peptides |
17
spectra |
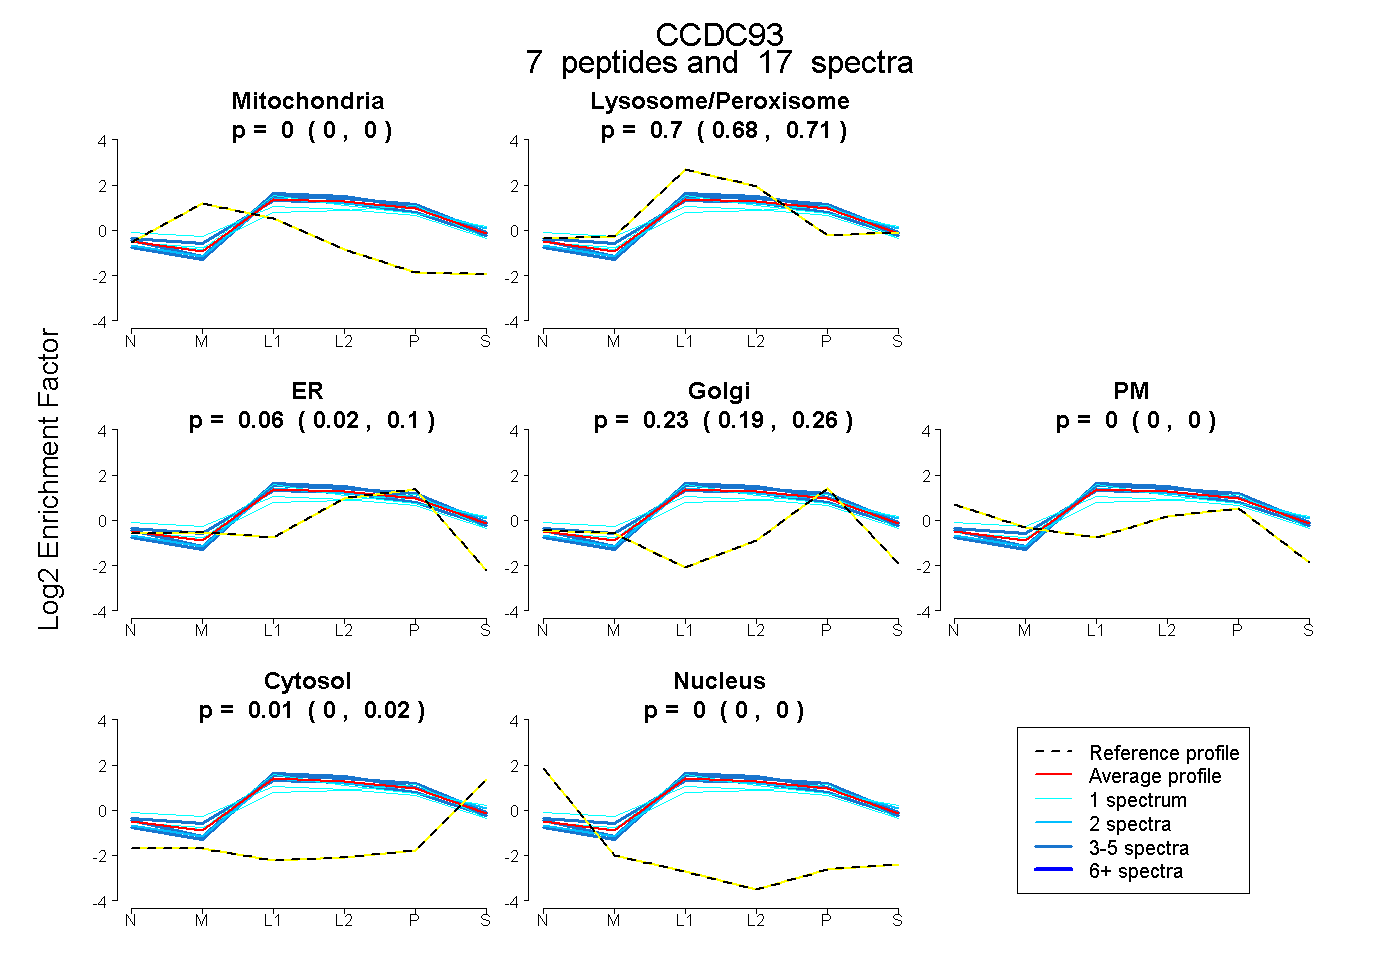 |
0.000
0.000 | 0.000 |
|
0.697
0.679 | 0.710 |
|
0.063
0.023 | 0.100 |
0.230
0.189 | 0.260 |
0.000
0.000 | 0.000 |
0.011
0.000 | 0.022 |
0.000
0.000 | 0.000 |
|
| 4 spectra, EIAILHR |
0.000 |
|
0.708 |
|
0.007 |
0.285 |
0.000 |
0.000 |
0.000 |
|
| 2 spectra, LQQEIEILK |
0.000 |
|
0.675 |
|
0.112 |
0.144 |
0.000 |
0.069 |
0.000 |
|
| 1 spectrum, SQEQEFK |
0.000 |
|
0.744 |
|
0.000 |
0.192 |
0.000 |
0.065 |
0.000 |
|
| 5 spectra, IVSVLPR |
0.000 |
|
0.705 |
|
0.175 |
0.112 |
0.000 |
0.008 |
0.000 |
|
| 1 spectrum, IALSEK |
0.000 |
|
0.656 |
|
0.000 |
0.336 |
0.008 |
0.000 |
0.000 |
|
| 1 spectrum, SYSISQFQK |
0.000 |
|
0.586 |
|
0.018 |
0.397 |
0.000 |
0.000 |
0.000 |
|
| 3 spectra, ADPSILQNLR |
0.000 |
|
0.631 |
|
0.311 |
0.000 |
0.000 |
0.058 |
0.000 |
|
| | | Plot |
|
Lyso |
|
|
|
|
|
|
|
Other |
| Expt C |
26
peptides |
86
spectra |
 |
|
0.956
0.342 | 0.999 |
|
|
|
|
|
|
|
0.044
0.001 | 0.648 |
| | | Plot |
|
Lyso |
|
|
|
|
|
|
|
Other |
| Expt D |
5
peptides |
12
spectra |
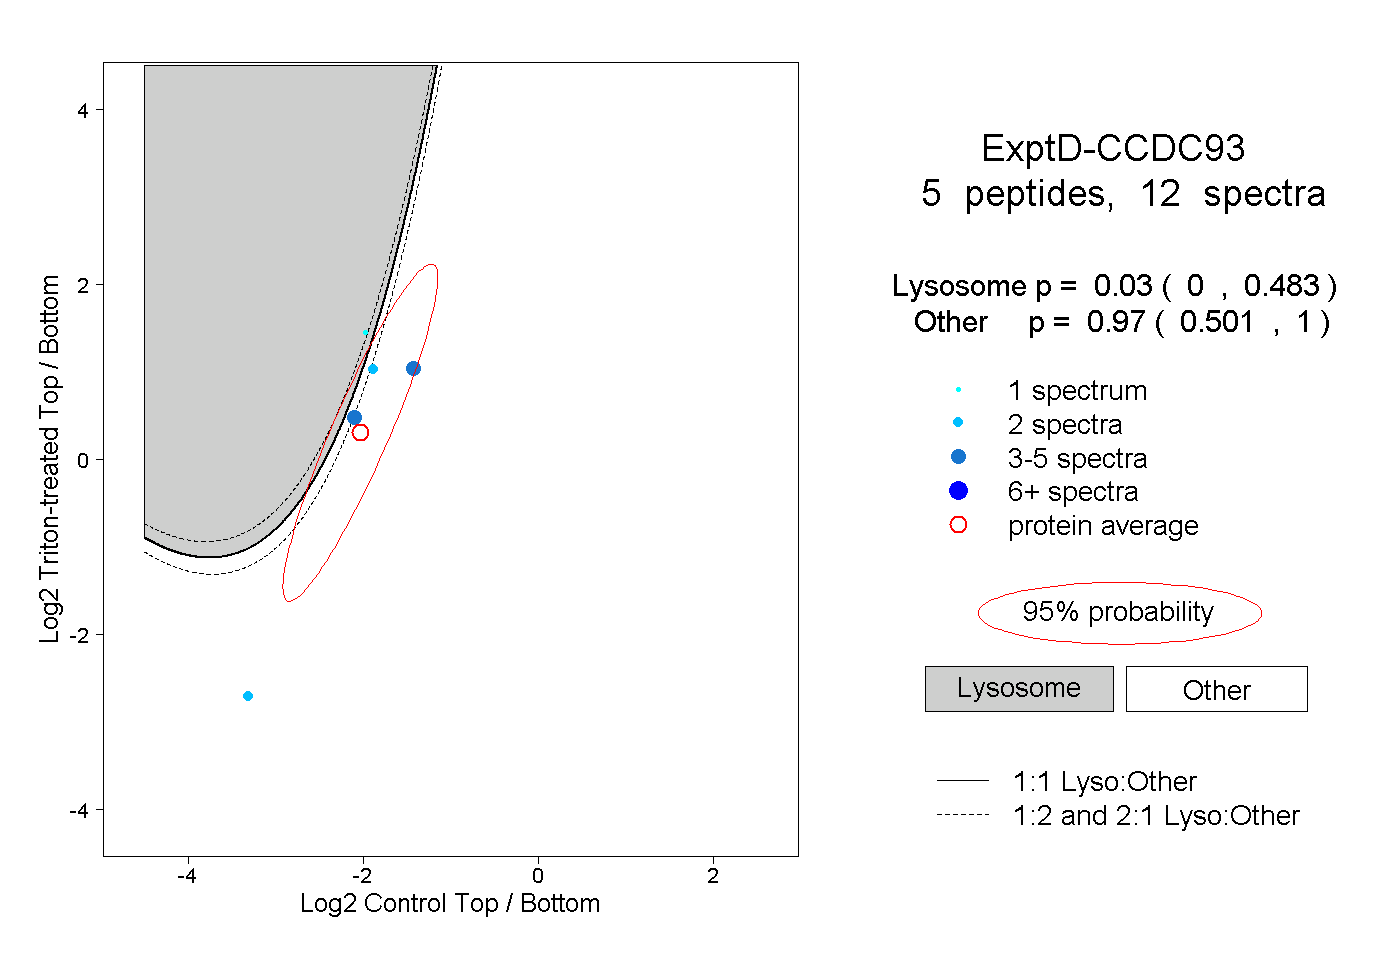 |
|
0.030
0.000 | 0.483 |
|
|
|
|
|
|
|
0.970
0.501 | 1.000 |