 19
19peptides
spectra
0.000 | 0.000
0.361 | 0.370
0.000 | 0.000
0.000 | 0.000
0.175 | 0.184
0.000 | 0.000
0.451 | 0.457
0.000 | 0.000
| Plot | Mito | Lyso | Perox | ER | Golgi | PM | Cytosol | Nucleus | |||||
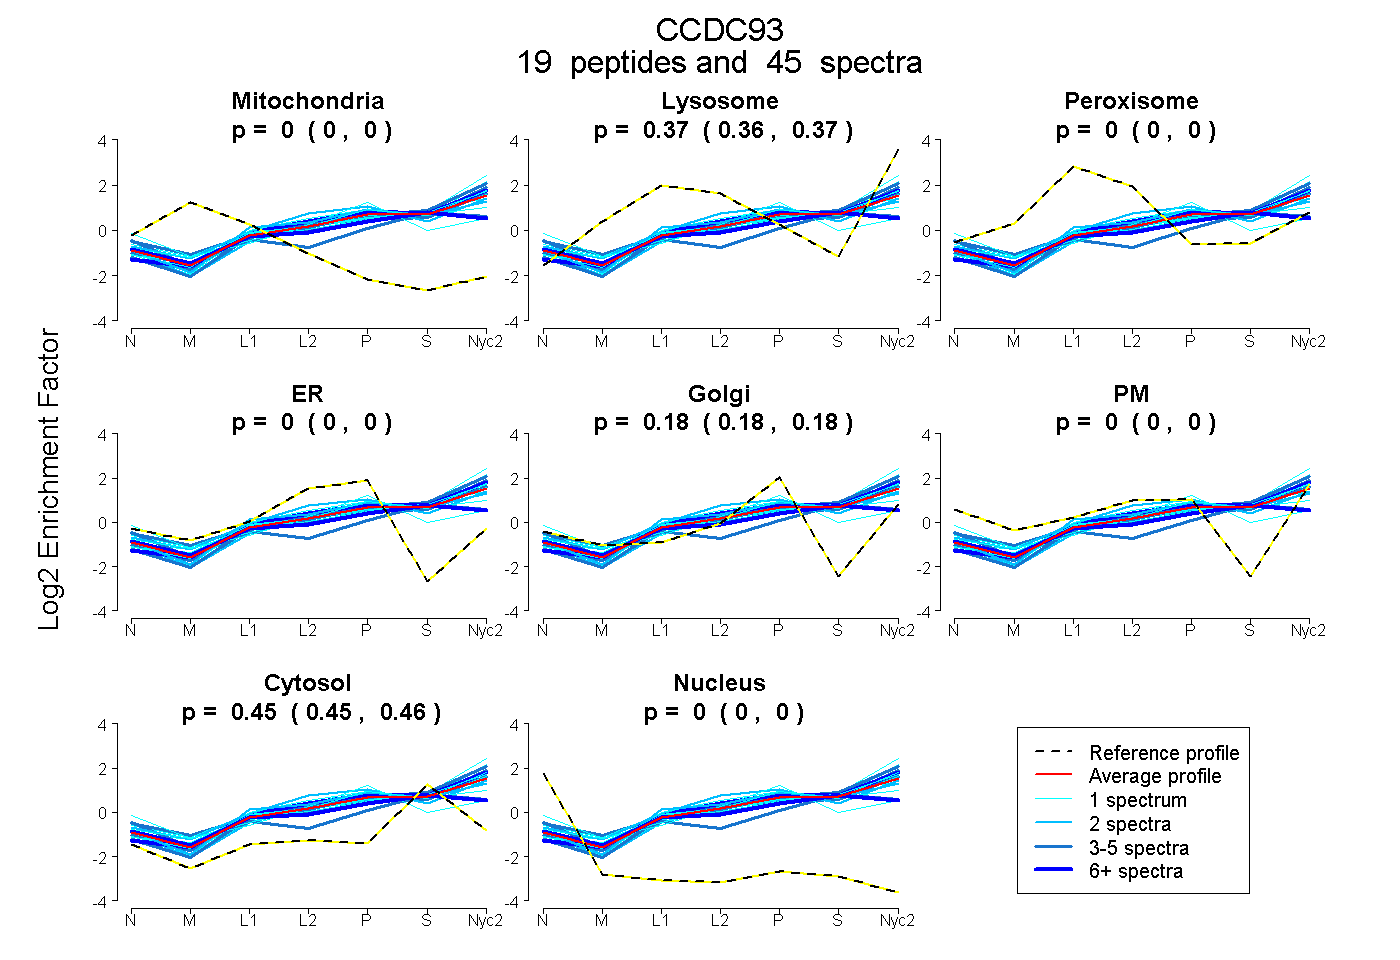
| Expt A |
19 peptides |
45 spectra |
|
0.000 0.000 | 0.000 |
0.366 0.361 | 0.370 |
0.000 0.000 | 0.000 |
0.000 0.000 | 0.000 |
0.180 0.175 | 0.184 |
0.000 0.000 | 0.000 |
0.454 0.451 | 0.457 |
0.000 0.000 | 0.000 |
| 6 spectra, MTAMANEESR | 0.000 | 0.431 | 0.000 | 0.000 | 0.136 | 0.000 | 0.433 | 0.000 | ||
| 4 spectra, LGTSQLHQR | 0.000 | 0.141 | 0.000 | 0.000 | 0.037 | 0.201 | 0.622 | 0.000 | ||
| 4 spectra, EEMGDYIR | 0.000 | 0.384 | 0.000 | 0.000 | 0.134 | 0.000 | 0.482 | 0.000 | ||
| 7 spectra, VHSTLLEYGR | 0.000 | 0.185 | 0.090 | 0.000 | 0.194 | 0.000 | 0.530 | 0.000 | ||
| 1 spectrum, QQGAEELLDEESR | 0.000 | 0.426 | 0.000 | 0.000 | 0.173 | 0.000 | 0.400 | 0.000 | ||
| 2 spectra, SYSISQFQK | 0.000 | 0.353 | 0.000 | 0.011 | 0.195 | 0.000 | 0.441 | 0.000 | ||
| 1 spectrum, AELIQYQK | 0.000 | 0.442 | 0.000 | 0.000 | 0.094 | 0.060 | 0.404 | 0.000 | ||
| 1 spectrum, TALAAGLSAAEK | 0.000 | 0.304 | 0.000 | 0.000 | 0.210 | 0.011 | 0.475 | 0.000 | ||
| 3 spectra, ADPSILQNLR | 0.000 | 0.335 | 0.000 | 0.000 | 0.092 | 0.133 | 0.439 | 0.000 | ||
| 1 spectrum, TYSLPEDDDFIK | 0.000 | 0.386 | 0.000 | 0.000 | 0.200 | 0.000 | 0.414 | 0.000 | ||
| 1 spectrum, AIQTVVDLSDAYKPR | 0.000 | 0.350 | 0.000 | 0.000 | 0.118 | 0.000 | 0.532 | 0.000 | ||
| 2 spectra, EIAILHR | 0.000 | 0.382 | 0.000 | 0.000 | 0.144 | 0.000 | 0.473 | 0.000 | ||
| 3 spectra, LQQEIEILK | 0.000 | 0.417 | 0.000 | 0.000 | 0.106 | 0.000 | 0.477 | 0.000 | ||
| 1 spectrum, FIELYR | 0.000 | 0.443 | 0.000 | 0.000 | 0.112 | 0.000 | 0.446 | 0.000 | ||
| 2 spectra, QIVSEYEGK | 0.000 | 0.377 | 0.000 | 0.086 | 0.191 | 0.000 | 0.347 | 0.000 | ||
| 3 spectra, IVSVLPR | 0.000 | 0.426 | 0.000 | 0.000 | 0.155 | 0.000 | 0.420 | 0.000 | ||
| 1 spectrum, SQEQEFK | 0.000 | 0.386 | 0.000 | 0.000 | 0.147 | 0.000 | 0.467 | 0.000 | ||
| 1 spectrum, LDQEQAALEK | 0.000 | 0.417 | 0.000 | 0.000 | 0.150 | 0.000 | 0.433 | 0.000 | ||
| 1 spectrum, QSELSAEESPEK | 0.000 | 0.000 | 0.119 | 0.000 | 0.400 | 0.158 | 0.323 | 0.000 |
| Plot | Mito | Lyso or Perox | ER | Golgi | PM | Cytosol | Nucleus | ||||||
| Expt B |
7 peptides |
17 spectra |
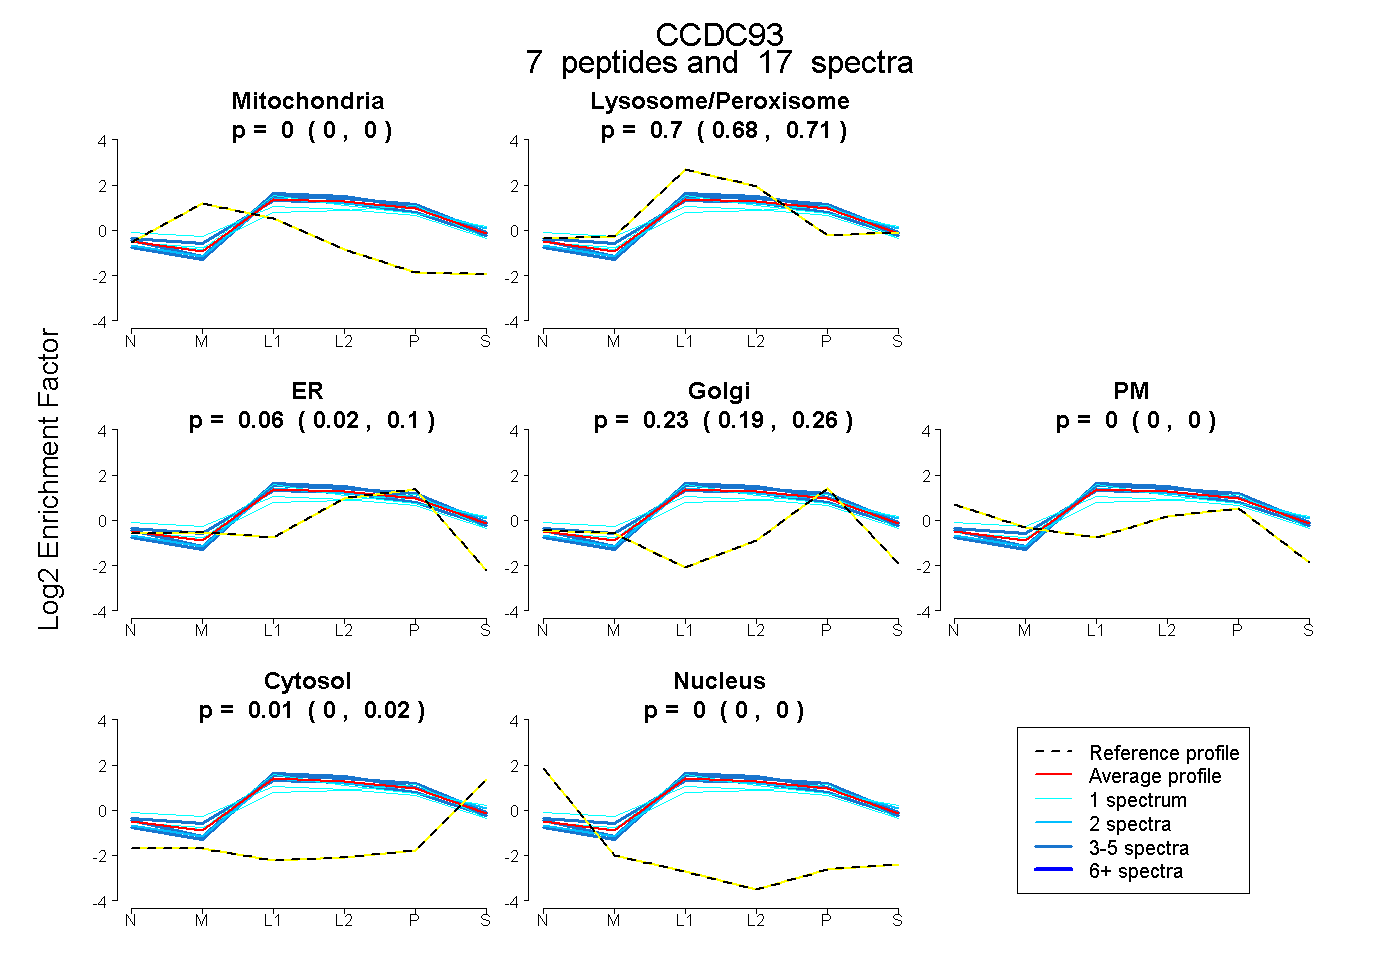 |
0.000 0.000 | 0.000 |
0.697 0.679 | 0.710 |
0.063 0.023 | 0.100 |
0.230 0.189 | 0.260 |
0.000 0.000 | 0.000 |
0.011 0.000 | 0.022 |
0.000 0.000 | 0.000 |
|||
| Plot | Lyso | Other | |||||||||||
| Expt C |
26 peptides |
86 spectra |
 |
0.956 0.342 | 0.999 |
0.044 0.001 | 0.648 |
||||||||
| Plot | Lyso | Other | |||||||||||
| Expt D |
5 peptides |
12 spectra |
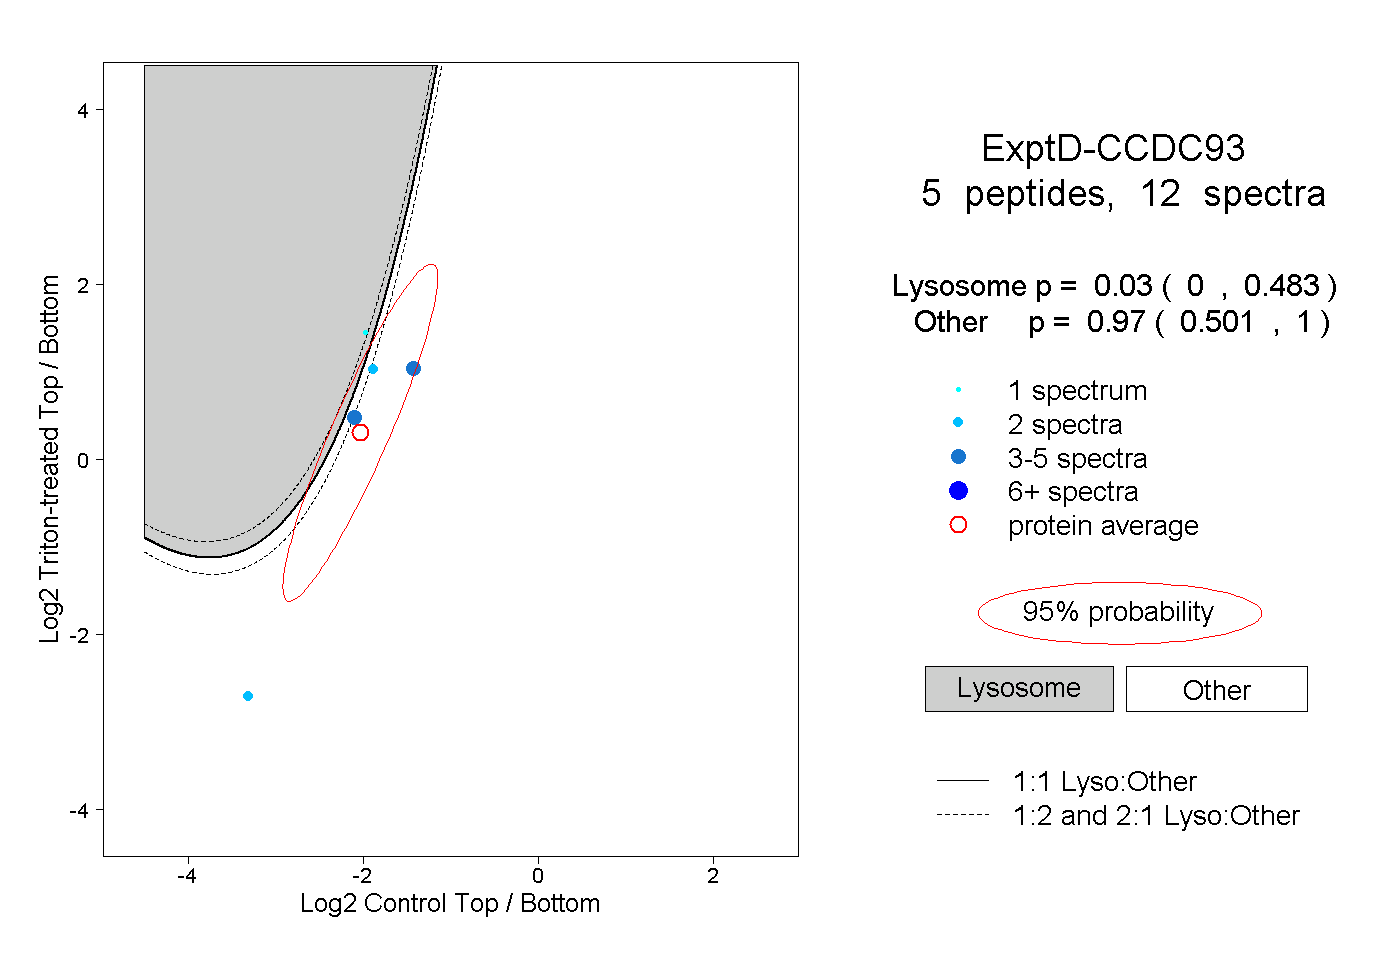 |
0.030 0.000 | 0.483 |
0.970 0.501 | 1.000 |