 8
8peptides
spectra
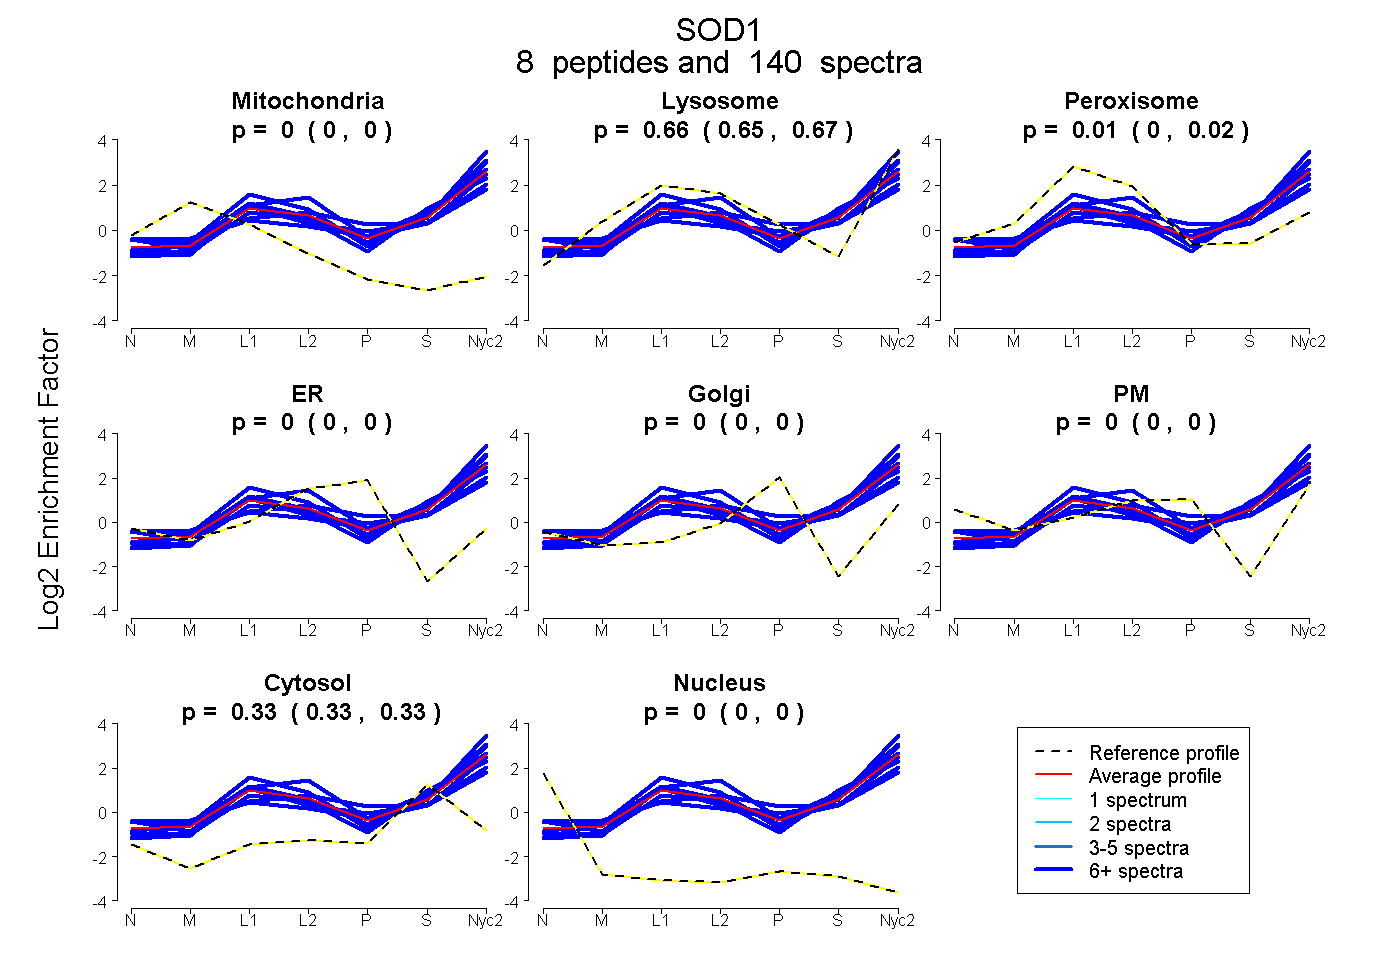
0.000 | 0.000
0.650 | 0.667
0.000 | 0.017
0.000 | 0.000
0.000 | 0.000
0.000 | 0.000
0.328 | 0.334
0.000 | 0.000
9peptides
spectra

0.000 | 0.000
0.327 | 0.332
0.000 | 0.000
0.000 | 0.000
0.000 | 0.000
0.668 | 0.672
0.000 | 0.000
10peptides
spectra
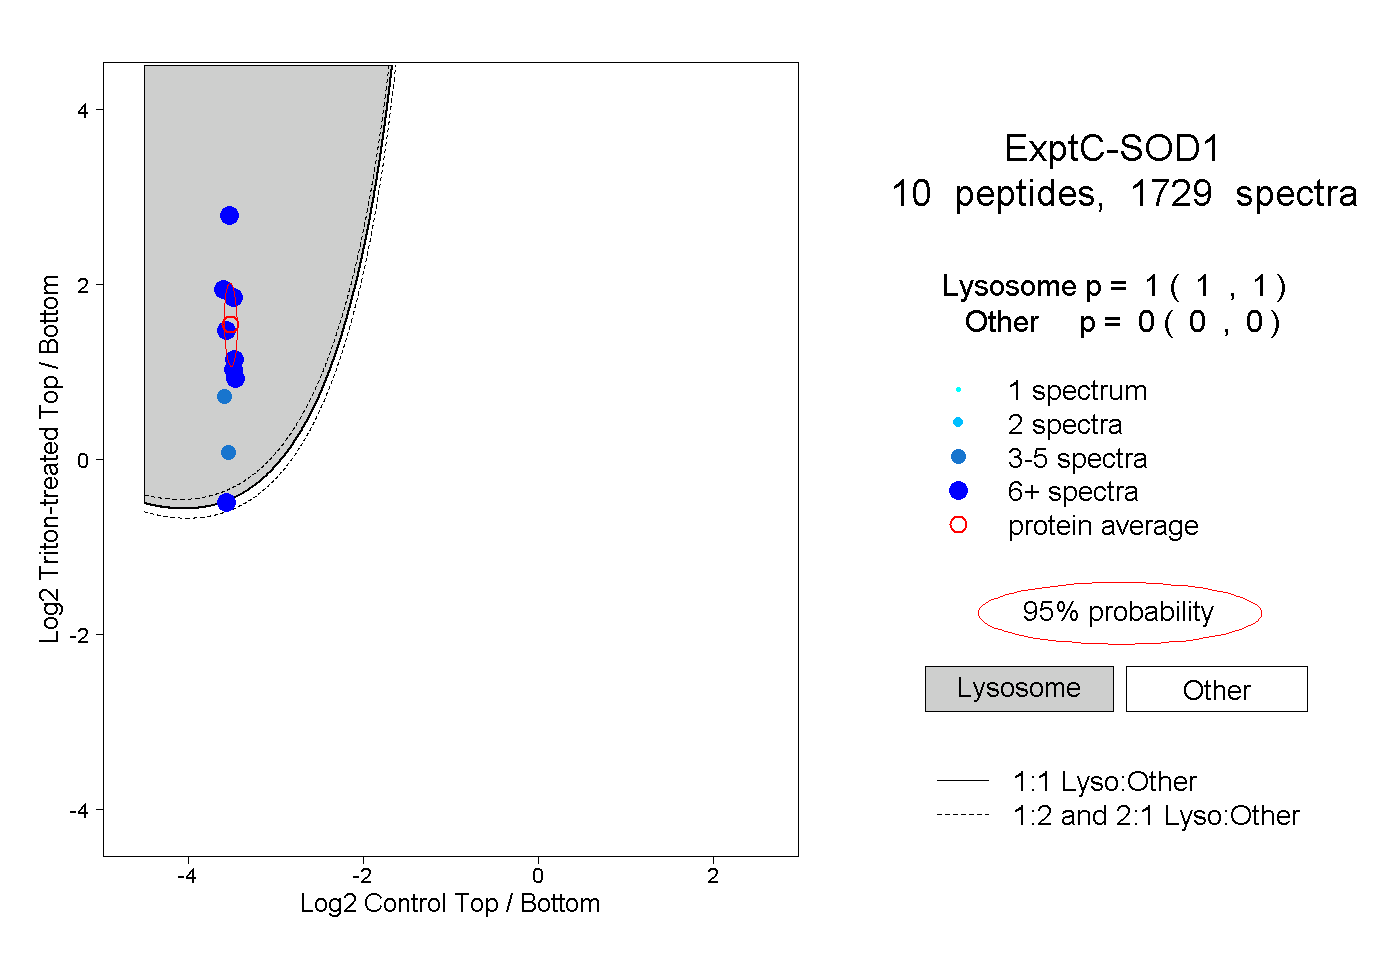
1.000 | 1.000
0.000 | 0.000
9peptides
spectra

0.984 | 1.000
0.000 | 0.013