 8
8peptides
spectra
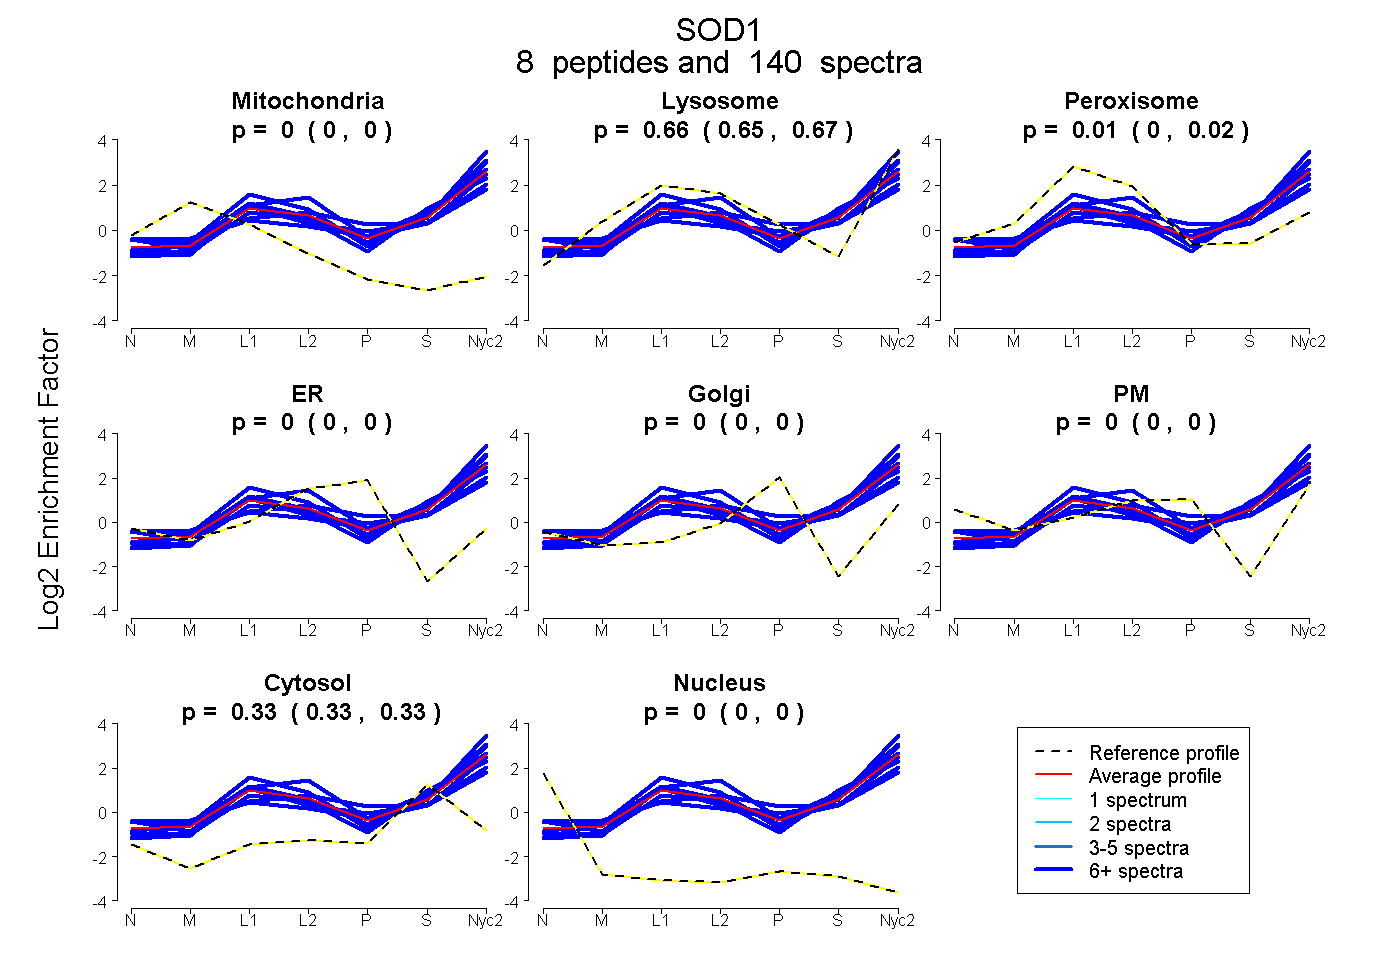
0.000 | 0.000
0.650 | 0.667
0.000 | 0.017
0.000 | 0.000
0.000 | 0.000
0.000 | 0.000
0.328 | 0.334
0.000 | 0.000
| Plot | Mito | Lyso | Perox | ER | Golgi | PM | Cytosol | Nucleus | |||||
| Expt A |
8 peptides |
140 spectra |
|
0.000 0.000 | 0.000 |
0.659 0.650 | 0.667 |
0.009 0.000 | 0.017 |
0.000 0.000 | 0.000 |
0.000 0.000 | 0.000 |
0.000 0.000 | 0.000 |
0.332 0.328 | 0.334 |
0.000 0.000 | 0.000 |
| 20 spectra, VISLSGEHSIIGR | 0.000 | 0.476 | 0.131 | 0.000 | 0.000 | 0.077 | 0.316 | 0.000 | ||
| 32 spectra, DGVANVSIEDR | 0.000 | 0.674 | 0.086 | 0.000 | 0.000 | 0.000 | 0.240 | 0.000 | ||
| 10 spectra, GDGPVQGVIHFEQK | 0.000 | 0.626 | 0.000 | 0.000 | 0.000 | 0.000 | 0.374 | 0.000 | ||
| 10 spectra, LACGVIGIAQ | 0.000 | 0.423 | 0.063 | 0.000 | 0.000 | 0.142 | 0.372 | 0.000 | ||
| 6 spectra, HGGPADEER | 0.000 | 0.774 | 0.000 | 0.000 | 0.000 | 0.000 | 0.226 | 0.000 | ||
| 18 spectra, TMVVHEK | 0.000 | 0.709 | 0.000 | 0.000 | 0.000 | 0.000 | 0.291 | 0.000 | ||
| 28 spectra, AVCVLK | 0.000 | 0.548 | 0.056 | 0.000 | 0.000 | 0.000 | 0.396 | 0.000 | ||
| 16 spectra, HVGDLGNVAAGK | 0.000 | 0.565 | 0.000 | 0.000 | 0.000 | 0.148 | 0.287 | 0.000 |
| Plot | Mito | Lyso or Perox | ER | Golgi | PM | Cytosol | Nucleus | ||||||
| Expt B |
9 peptides |
74 spectra |
 |
0.000 0.000 | 0.000 |
0.330 0.327 | 0.332 |
0.000 0.000 | 0.000 |
0.000 0.000 | 0.000 |
0.000 0.000 | 0.000 |
0.670 0.668 | 0.672 |
0.000 0.000 | 0.000 |
|||
| Plot | Lyso | Other | |||||||||||
| Expt C |
10 peptides |
1729 spectra |
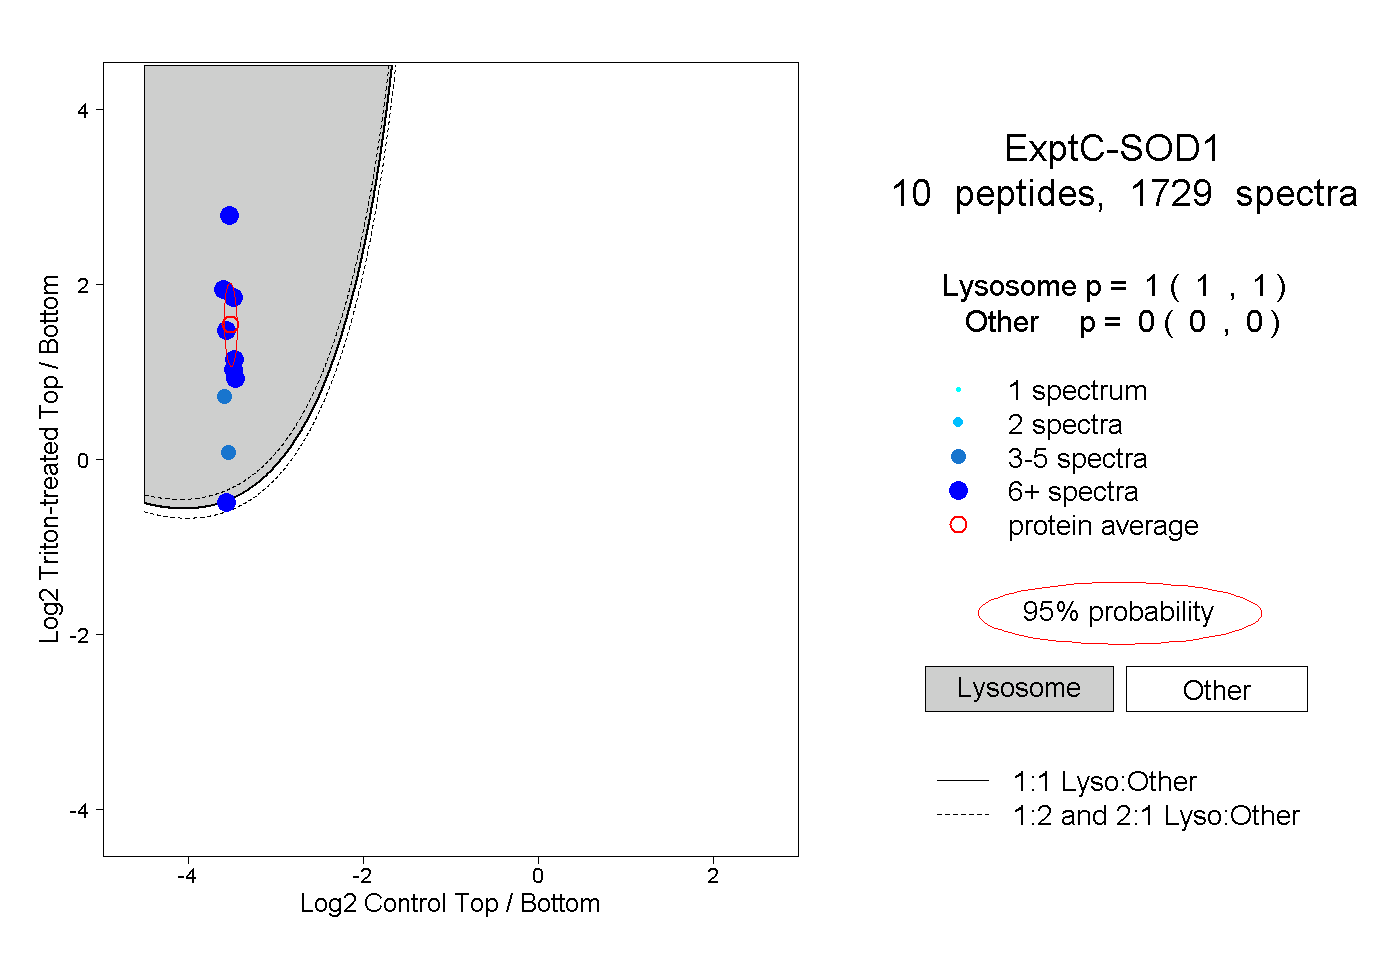 |
1.000 1.000 | 1.000 |
0.000 0.000 | 0.000 |
||||||||
| Plot | Lyso | Other | |||||||||||
| Expt D |
9 peptides |
47 spectra |
 |
1.000 0.984 | 1.000 |
0.000 0.000 | 0.013 |