 31
31peptides
spectra
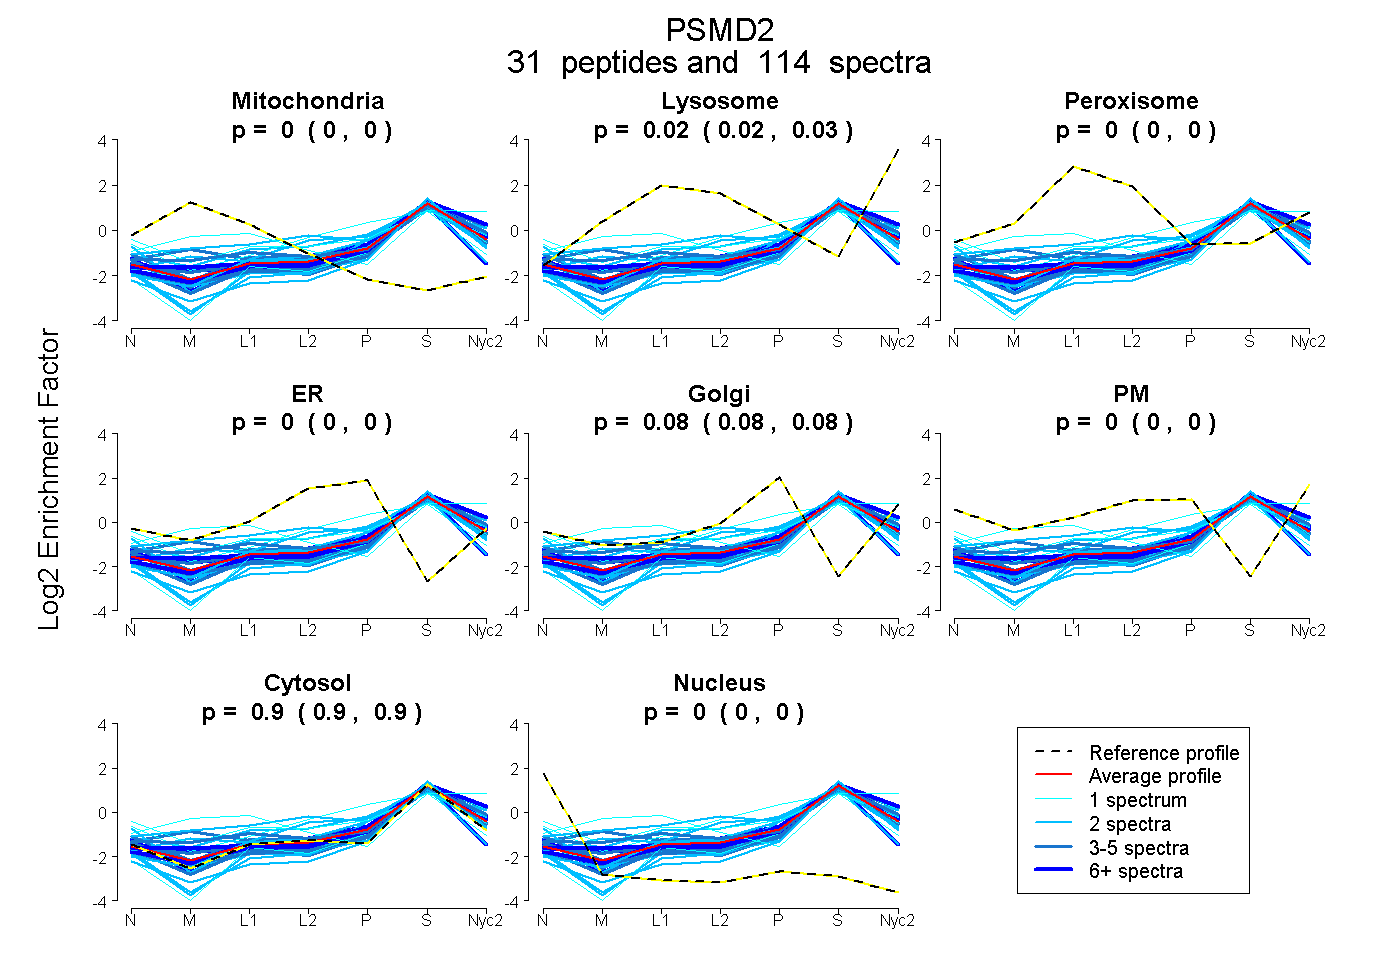
0.000 | 0.000
0.022 | 0.027
0.000 | 0.000
0.000 | 0.000
0.076 | 0.080
0.000 | 0.000
0.895 | 0.899
0.000 | 0.000
16peptides
spectra

0.000 | 0.000
0.000 | 0.000
0.000 | 0.000
0.011 | 0.019
0.000 | 0.000
0.980 | 0.989
0.000 | 0.000
29peptides
spectra

0.000 | 0.000
1.000 | 1.000
5peptides
spectra
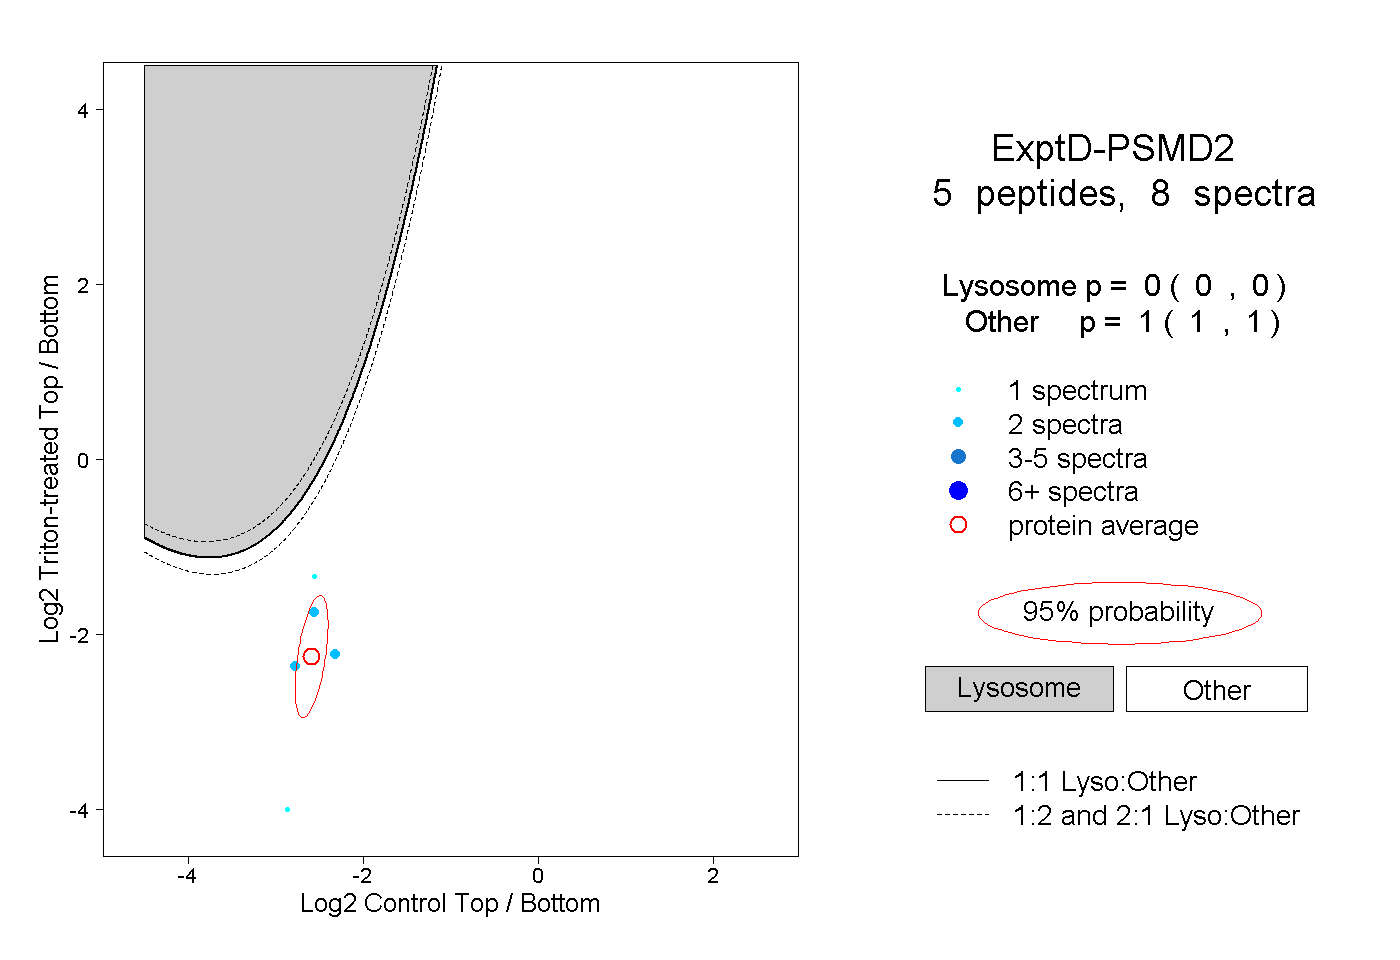
0.000 | 0.000
1.000 | 1.000