| 6 spectra, MLVTFDEELRPLPVSVR |
0.000 |
|
0.055 |
|
0.000 |
0.001 |
0.000 |
0.944 |
0.000 |
|
| 3 spectra, HLAGEVAK |
0.000 |
|
0.000 |
|
0.000 |
0.109 |
0.000 |
0.891 |
0.000 |
|
| 1 spectrum, EWQELDDAEK |
0.000 |
|
0.000 |
|
0.000 |
0.000 |
0.000 |
1.000 |
0.000 |
|
| 2 spectra, FGGSGSQVDSAR |
0.000 |
|
0.000 |
|
0.000 |
0.000 |
0.000 |
0.974 |
0.026 |
|
| 3 spectra, SGALLACGIVNSGVR |
0.000 |
|
0.051 |
|
0.000 |
0.067 |
0.000 |
0.883 |
0.000 |
|
| 4 spectra, DPNNLFMVR |
0.000 |
|
0.000 |
|
0.000 |
0.000 |
0.000 |
1.000 |
0.000 |
|
| 3 spectra, FPEALR |
0.000 |
|
0.000 |
|
0.000 |
0.000 |
0.000 |
0.990 |
0.010 |
|
| 1 spectrum, EDVLTLLLPVMGDSK |
0.000 |
|
0.176 |
|
0.000 |
0.030 |
0.000 |
0.793 |
0.000 |
|
| 7 spectra, TFGHLLR |
0.000 |
|
0.000 |
|
0.000 |
0.016 |
0.000 |
0.984 |
0.000 |
|
| 3 spectra, LAAMLR |
0.000 |
|
0.000 |
|
0.000 |
0.000 |
0.000 |
1.000 |
0.000 |
|
| 1 spectrum, LAQGLTHLGK |
0.000 |
|
0.000 |
|
0.000 |
0.000 |
0.000 |
1.000 |
0.000 |
|
| 2 spectra, CALGVFR |
0.000 |
|
0.000 |
|
0.000 |
0.000 |
0.000 |
0.985 |
0.015 |
|
| 2 spectra, YGEPTLR |
0.000 |
|
0.000 |
|
0.000 |
0.072 |
0.000 |
0.928 |
0.000 |
|
| 2 spectra, FLRPHYGK |
0.000 |
|
0.000 |
|
0.000 |
0.000 |
0.000 |
1.000 |
0.000 |
|
| 1 spectrum, YLYSSEDYIK |
0.000 |
|
0.000 |
|
0.000 |
0.074 |
0.000 |
0.926 |
0.000 |
|
| 1 spectrum, GTLTLCPYHSDR |
0.057 |
|
0.202 |
|
0.000 |
0.000 |
0.149 |
0.489 |
0.103 |
|
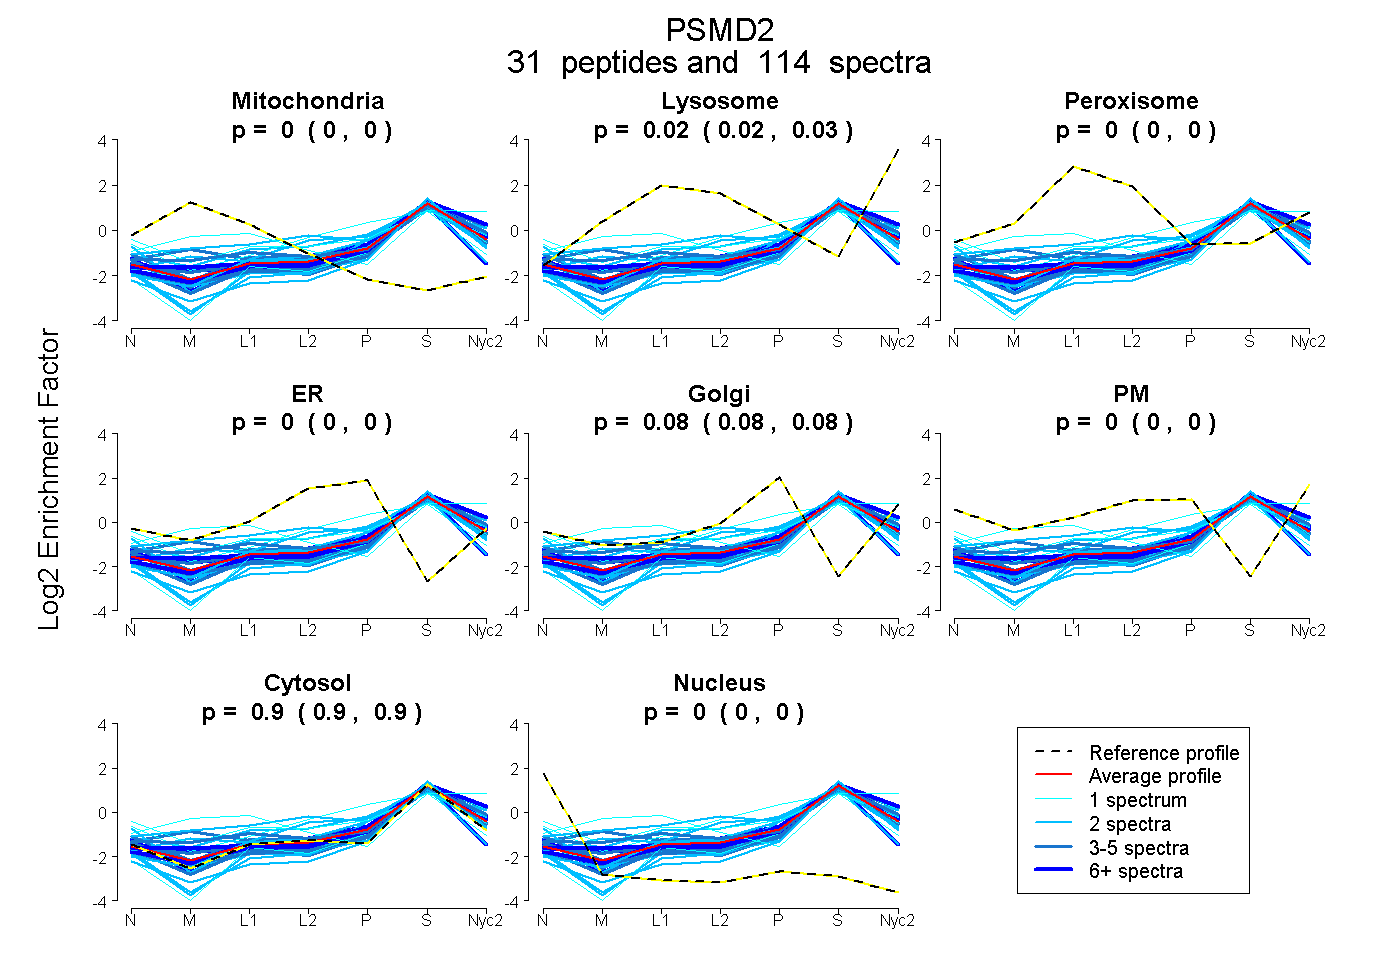
 31
31