 31
31peptides
spectra
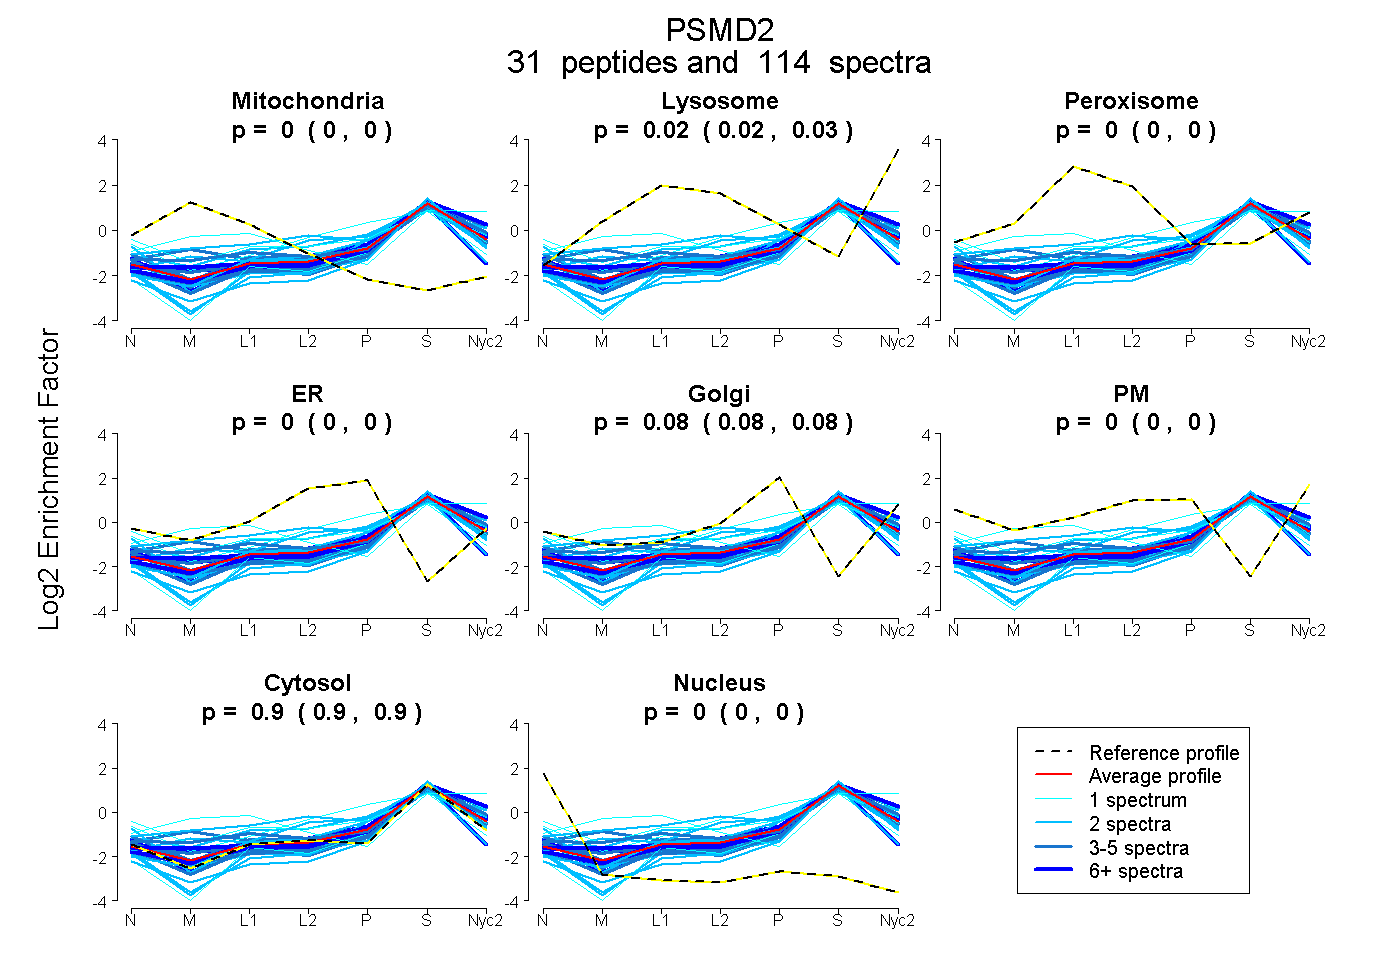
0.000 | 0.000
0.022 | 0.027
0.000 | 0.000
0.000 | 0.000
0.076 | 0.080
0.000 | 0.000
0.895 | 0.899
0.000 | 0.000
| Plot | Mito | Lyso | Perox | ER | Golgi | PM | Cytosol | Nucleus | |||||
| Expt A |
31 peptides |
114 spectra |
|
0.000 0.000 | 0.000 |
0.024 0.022 | 0.027 |
0.000 0.000 | 0.000 |
0.000 0.000 | 0.000 |
0.079 0.076 | 0.080 |
0.000 0.000 | 0.000 |
0.897 0.895 | 0.899 |
0.000 0.000 | 0.000 |
| 4 spectra, ELDIMEPK | 0.000 | 0.091 | 0.000 | 0.000 | 0.058 | 0.000 | 0.851 | 0.000 | ||
| 4 spectra, LNILDTLSK | 0.000 | 0.000 | 0.000 | 0.000 | 0.050 | 0.000 | 0.950 | 0.000 | ||
| 2 spectra, HLAGEVAK | 0.000 | 0.000 | 0.000 | 0.000 | 0.143 | 0.000 | 0.846 | 0.011 | ||
| 1 spectrum, SSTTSMTSVPKPLK | 0.000 | 0.000 | 0.000 | 0.000 | 0.000 | 0.000 | 1.000 | 0.000 | ||
| 3 spectra, QLQDELEMLVER | 0.000 | 0.000 | 0.000 | 0.000 | 0.016 | 0.000 | 0.984 | 0.000 | ||
| 1 spectrum, TITGFQTHTTPVLLAHGER | 0.190 | 0.082 | 0.156 | 0.000 | 0.000 | 0.000 | 0.572 | 0.000 | ||
| 7 spectra, TFGHLLR | 0.007 | 0.058 | 0.000 | 0.000 | 0.052 | 0.000 | 0.883 | 0.000 | ||
| 4 spectra, LAAMLR | 0.000 | 0.071 | 0.000 | 0.000 | 0.068 | 0.000 | 0.861 | 0.000 | ||
| 2 spectra, DVVVQK | 0.000 | 0.017 | 0.112 | 0.000 | 0.161 | 0.000 | 0.710 | 0.000 | ||
| 2 spectra, EPLLTLVK | 0.000 | 0.000 | 0.000 | 0.000 | 0.000 | 0.000 | 0.998 | 0.002 | ||
| 5 spectra, LAQGLTHLGK | 0.000 | 0.000 | 0.000 | 0.000 | 0.053 | 0.000 | 0.947 | 0.000 | ||
| 8 spectra, CALGVFR | 0.039 | 0.000 | 0.000 | 0.075 | 0.000 | 0.000 | 0.886 | 0.000 | ||
| 4 spectra, YGEPTLR | 0.041 | 0.153 | 0.000 | 0.000 | 0.009 | 0.000 | 0.797 | 0.000 | ||
| 2 spectra, THLENNR | 0.003 | 0.133 | 0.161 | 0.000 | 0.084 | 0.000 | 0.618 | 0.000 | ||
| 2 spectra, QLAQYHAK | 0.000 | 0.000 | 0.000 | 0.000 | 0.093 | 0.000 | 0.907 | 0.000 | ||
| 5 spectra, EIYENMAPGENK | 0.000 | 0.007 | 0.000 | 0.000 | 0.086 | 0.034 | 0.873 | 0.000 | ||
| 3 spectra, DTSLYRPALEELR | 0.139 | 0.078 | 0.000 | 0.000 | 0.031 | 0.000 | 0.752 | 0.000 | ||
| 2 spectra, LLTDDGNK | 0.000 | 0.000 | 0.000 | 0.000 | 0.000 | 0.000 | 1.000 | 0.000 | ||
| 7 spectra, MLVTFDEELRPLPVSVR | 0.000 | 0.029 | 0.000 | 0.000 | 0.039 | 0.000 | 0.932 | 0.000 | ||
| 5 spectra, EWQELDDAEK | 0.000 | 0.035 | 0.000 | 0.000 | 0.058 | 0.000 | 0.908 | 0.000 | ||
| 1 spectrum, FGGSGSQVDSAR | 0.000 | 0.085 | 0.000 | 0.000 | 0.018 | 0.000 | 0.897 | 0.000 | ||
| 2 spectra, SGALLACGIVNSGVR | 0.145 | 0.000 | 0.000 | 0.028 | 0.000 | 0.000 | 0.827 | 0.000 | ||
| 9 spectra, DPNNLFMVR | 0.000 | 0.000 | 0.000 | 0.000 | 0.065 | 0.000 | 0.935 | 0.000 | ||
| 2 spectra, FPEALR | 0.000 | 0.000 | 0.000 | 0.000 | 0.000 | 0.000 | 1.000 | 0.000 | ||
| 5 spectra, EDVLTLLLPVMGDSK | 0.000 | 0.000 | 0.000 | 0.000 | 0.010 | 0.000 | 0.990 | 0.000 | ||
| 10 spectra, QMAFMLGR | 0.000 | 0.099 | 0.000 | 0.000 | 0.025 | 0.000 | 0.876 | 0.000 | ||
| 2 spectra, WLPLGLGLNHLGK | 0.000 | 0.094 | 0.000 | 0.018 | 0.057 | 0.000 | 0.831 | 0.000 | ||
| 6 spectra, FLRPHYGK | 0.000 | 0.052 | 0.000 | 0.000 | 0.092 | 0.000 | 0.856 | 0.000 | ||
| 1 spectrum, VPDDIYK | 0.000 | 0.157 | 0.000 | 0.000 | 0.000 | 0.198 | 0.645 | 0.000 | ||
| 1 spectrum, GTLTLCPYHSDR | 0.000 | 0.000 | 0.000 | 0.310 | 0.000 | 0.000 | 0.690 | 0.000 | ||
| 2 spectra, YLYSSEDYIK | 0.000 | 0.000 | 0.000 | 0.000 | 0.000 | 0.000 | 0.996 | 0.004 |
| Plot | Mito | Lyso or Perox | ER | Golgi | PM | Cytosol | Nucleus | ||||||
| Expt B |
16 peptides |
42 spectra |
 |
0.000 0.000 | 0.000 |
0.000 0.000 | 0.000 |
0.000 0.000 | 0.000 |
0.015 0.011 | 0.019 |
0.000 0.000 | 0.000 |
0.985 0.980 | 0.989 |
0.000 0.000 | 0.000 |
|||
| Plot | Lyso | Other | |||||||||||
| Expt C |
29 peptides |
103 spectra |
 |
0.000 0.000 | 0.000 |
1.000 1.000 | 1.000 |
||||||||
| Plot | Lyso | Other | |||||||||||
| Expt D |
5 peptides |
8 spectra |
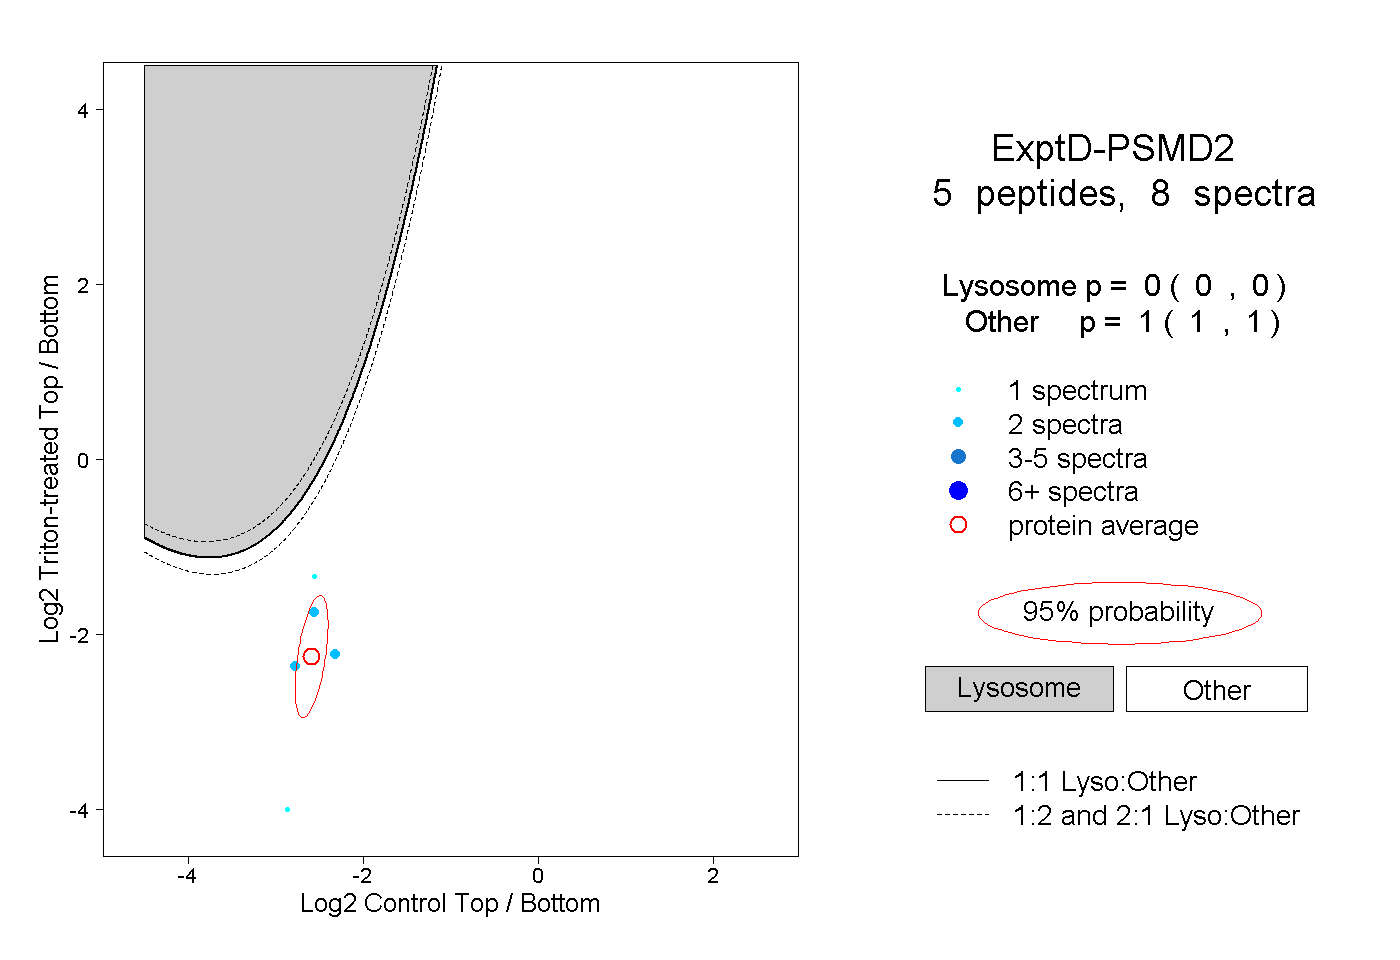 |
0.000 0.000 | 0.000 |
1.000 1.000 | 1.000 |