 5
5peptides
spectra
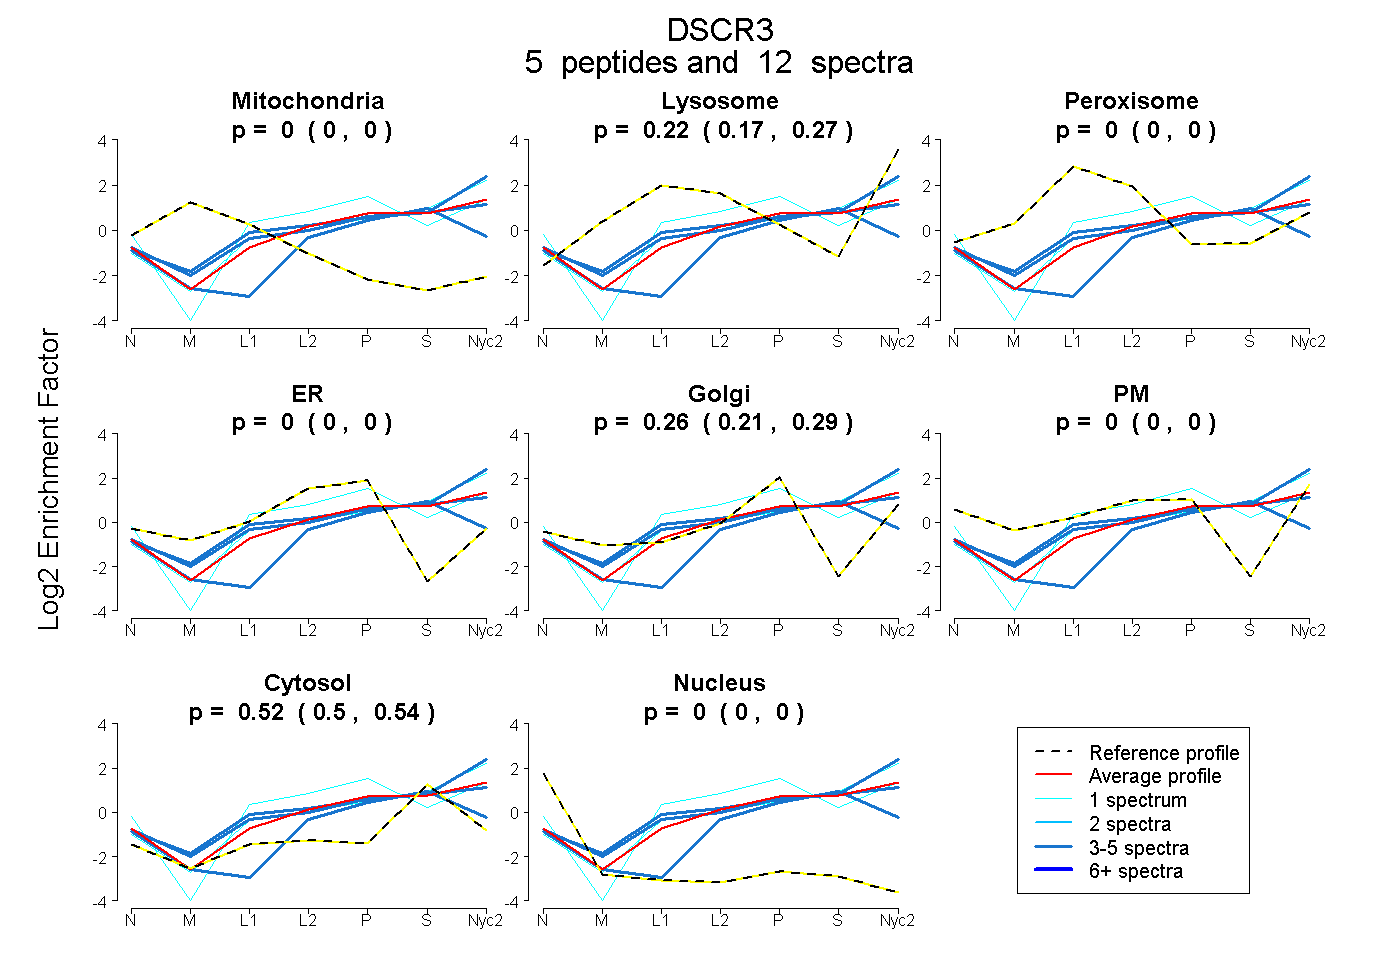
0.000 | 0.000
0.172 | 0.267
0.000 | 0.000
0.000 | 0.000
0.214 | 0.288
0.000 | 0.000
0.496 | 0.543
0.000 | 0.000
3peptides
spectra
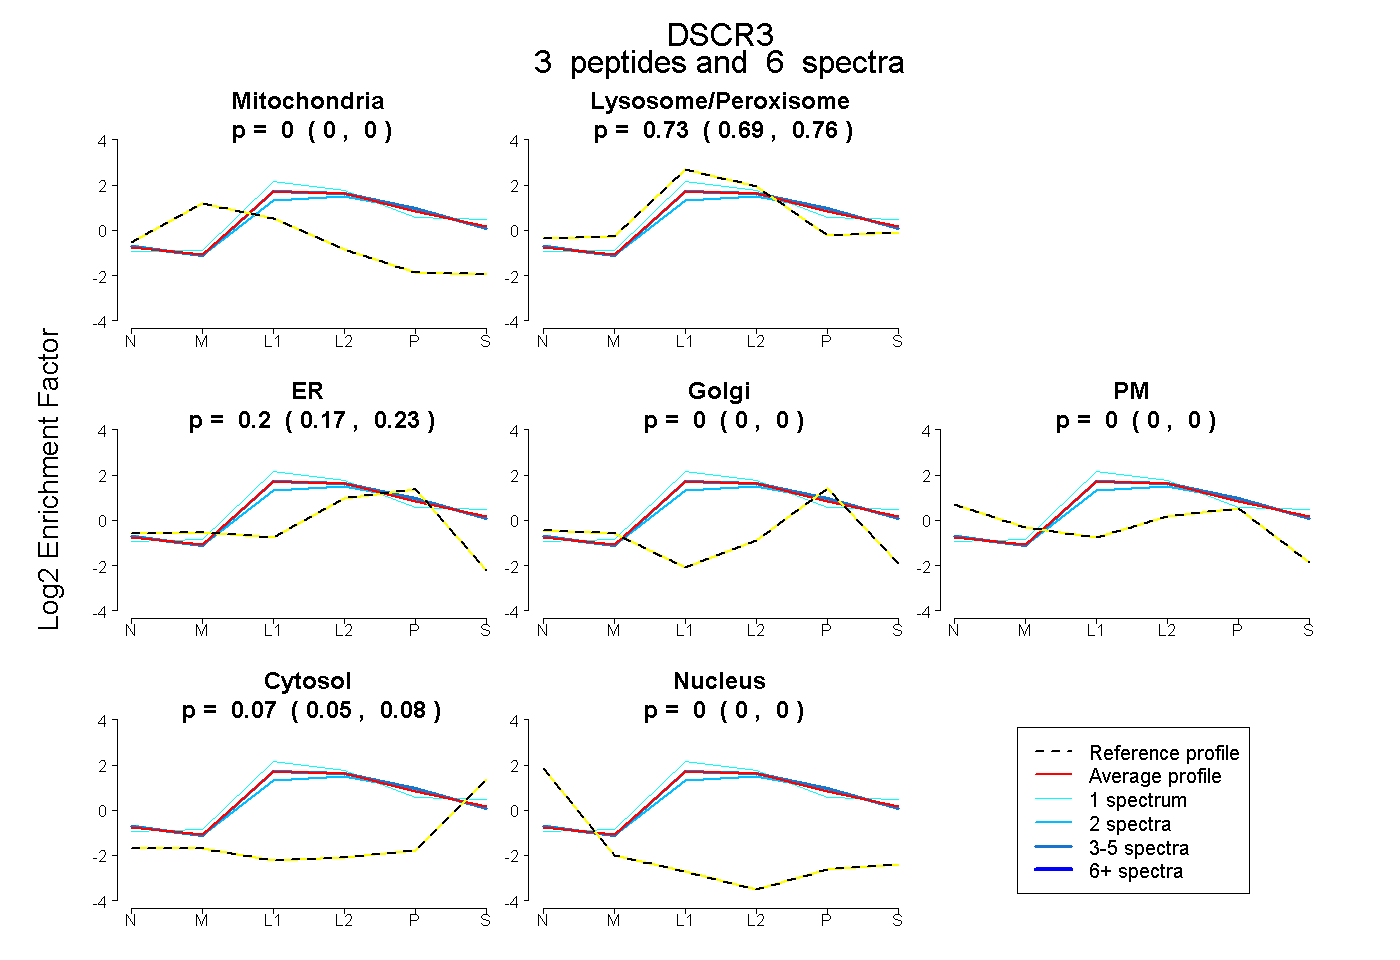
0.000 | 0.000
0.692 | 0.760
0.167 | 0.225
0.000 | 0.000
0.000 | 0.000
0.054 | 0.085
0.000 | 0.000
6peptides
spectra
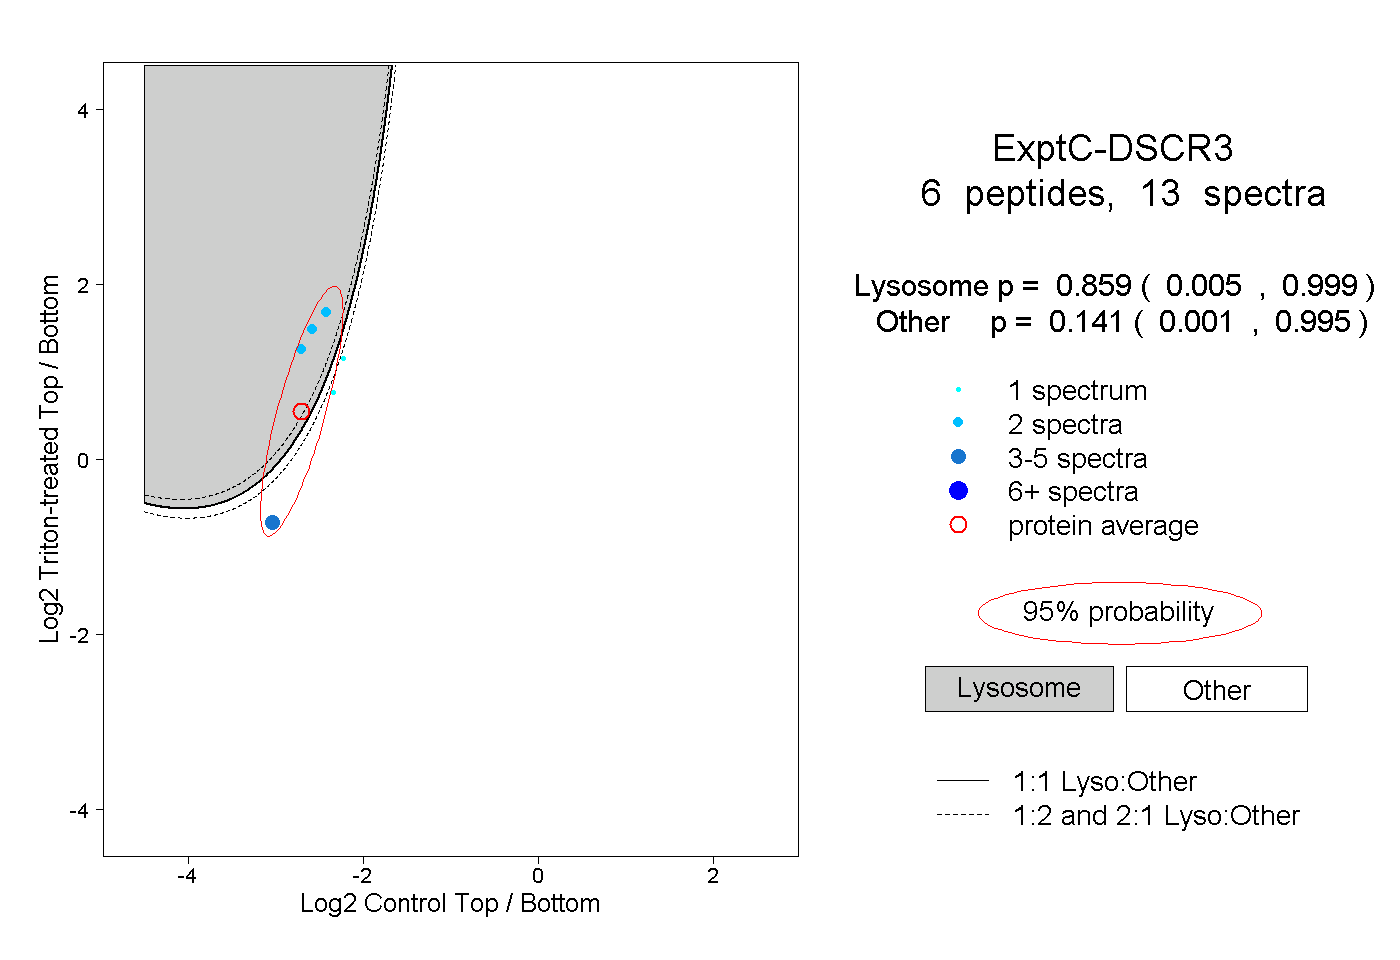
0.005 | 0.999
0.001 | 0.995