 5
5peptides
spectra
0.000 | 0.000
0.172 | 0.267
0.000 | 0.000
0.000 | 0.000
0.214 | 0.288
0.000 | 0.000
0.496 | 0.543
0.000 | 0.000
| Plot | Mito | Lyso | Perox | ER | Golgi | PM | Cytosol | Nucleus | |||||
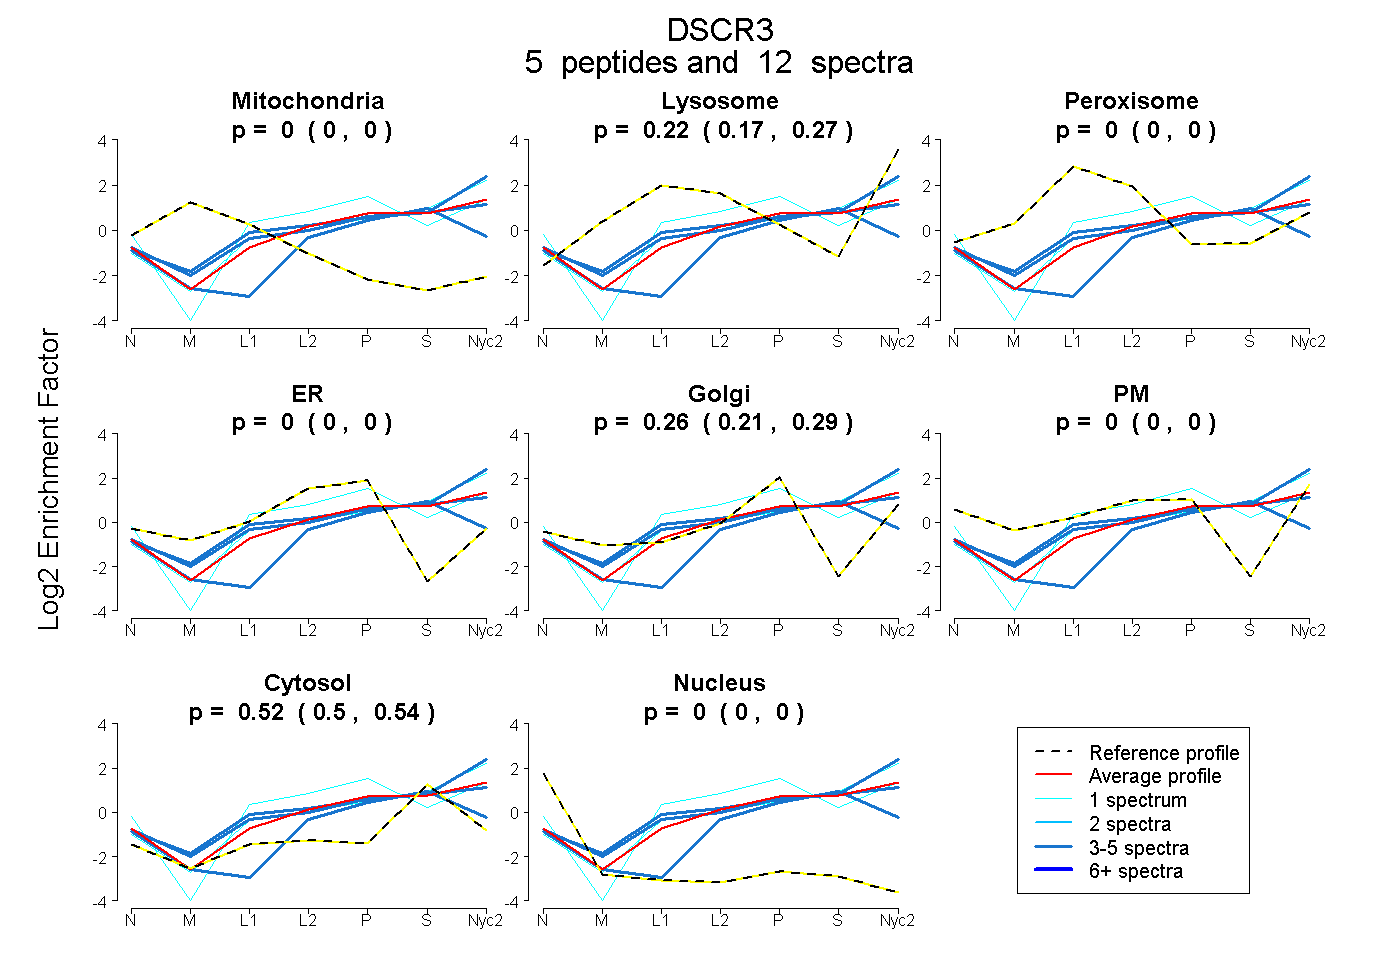
| Expt A |
5 peptides |
12 spectra |
|
0.000 0.000 | 0.000 |
0.224 0.172 | 0.267 |
0.000 0.000 | 0.000 |
0.000 0.000 | 0.000 |
0.255 0.214 | 0.288 |
0.000 0.000 | 0.000 |
0.521 0.496 | 0.543 |
0.000 0.000 | 0.000 |
| 4 spectra, VETCGCAEGYAR | 0.000 | 0.000 | 0.000 | 0.000 | 0.278 | 0.000 | 0.722 | 0.000 | ||
| 3 spectra, TEVPFEFPLLVK | 0.000 | 0.467 | 0.000 | 0.000 | 0.095 | 0.000 | 0.438 | 0.000 | ||
| 1 spectrum, NLSVPLYMVFPR | 0.000 | 0.180 | 0.000 | 0.179 | 0.187 | 0.057 | 0.397 | 0.000 | ||
| 3 spectra, TCEFIVHSAPQK | 0.000 | 0.275 | 0.000 | 0.000 | 0.207 | 0.000 | 0.518 | 0.000 | ||
| 1 spectrum, SIELQLVR | 0.000 | 0.376 | 0.000 | 0.000 | 0.096 | 0.000 | 0.528 | 0.000 |
| Plot | Mito | Lyso or Perox | ER | Golgi | PM | Cytosol | Nucleus | ||||||
| Expt B |
3 peptides |
6 spectra |
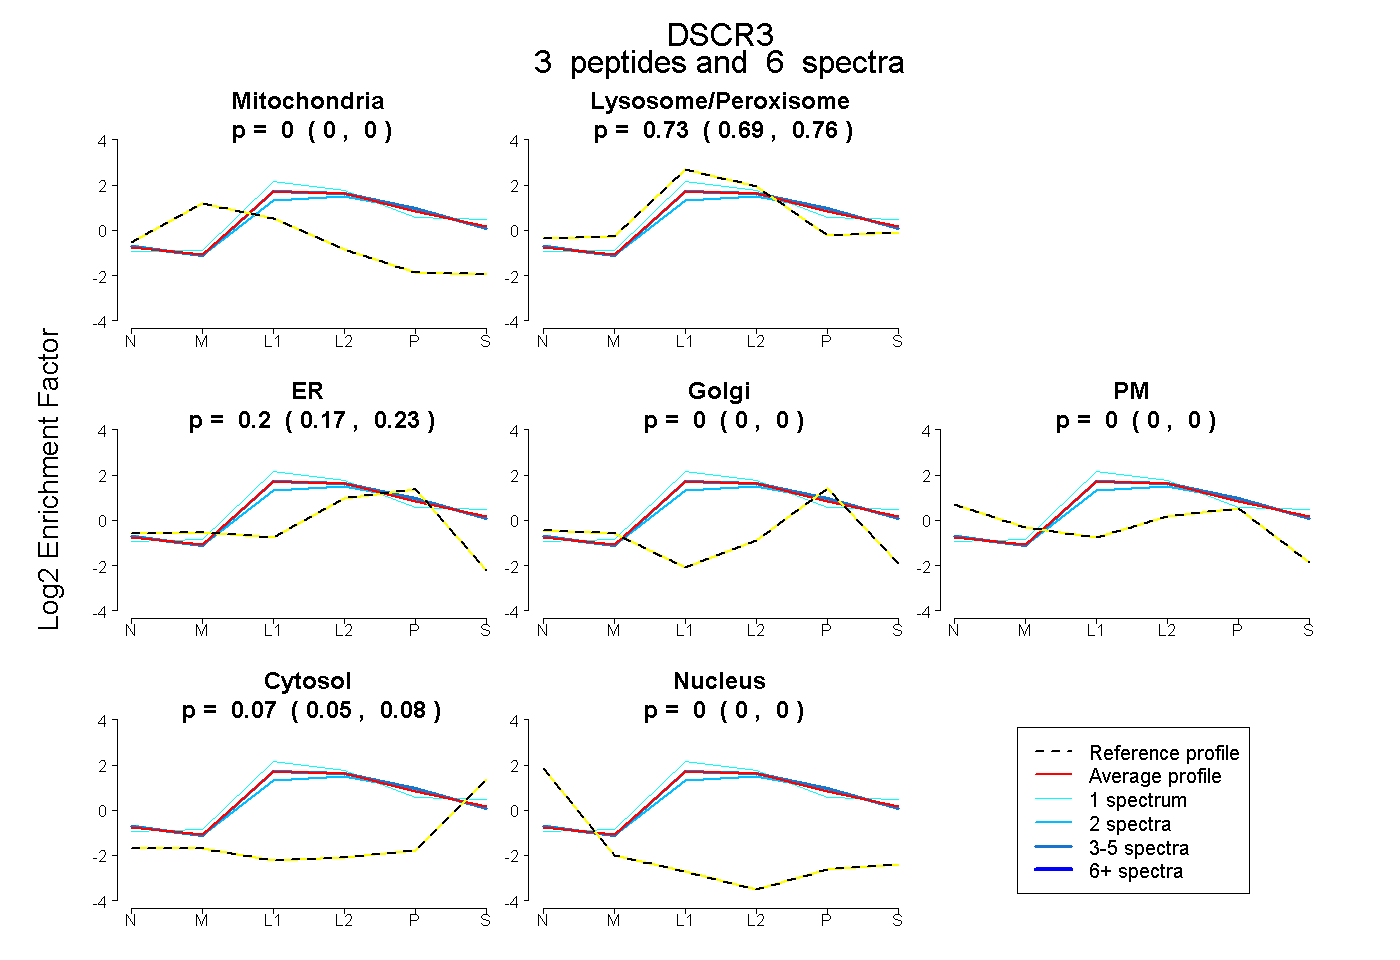 |
0.000 0.000 | 0.000 |
0.728 0.692 | 0.760 |
0.201 0.167 | 0.225 |
0.000 0.000 | 0.000 |
0.000 0.000 | 0.000 |
0.071 0.054 | 0.085 |
0.000 0.000 | 0.000 |
|||
| Plot | Lyso | Other | |||||||||||
| Expt C |
6 peptides |
13 spectra |
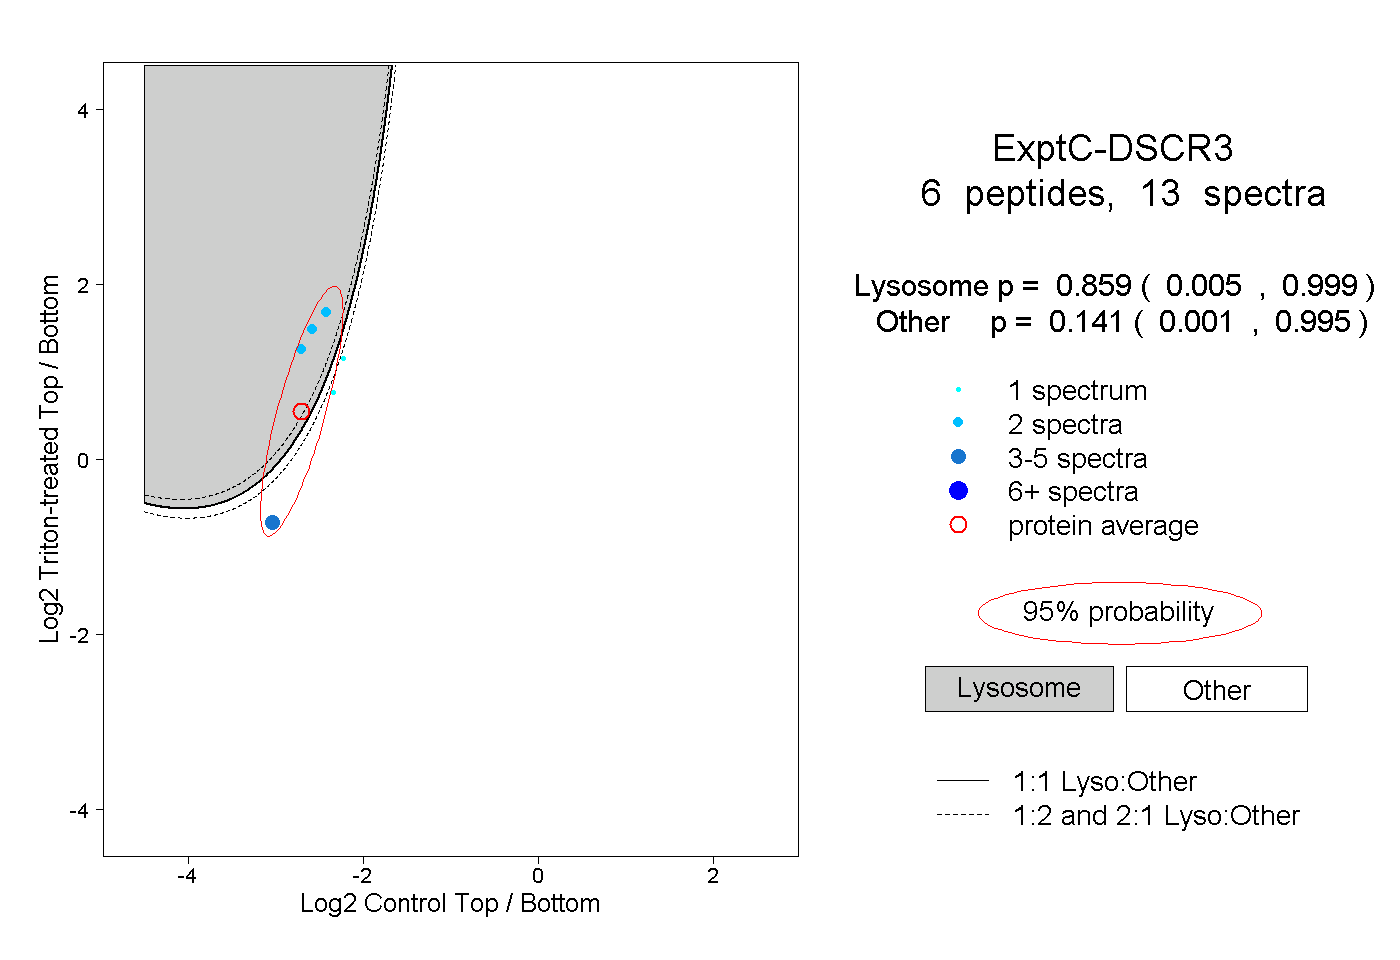 |
0.859 0.005 | 0.999 |
0.141 0.001 | 0.995 |