DSCR3
[ENSRNOP00000002284]
Main page
| | | Plot |
Mito |
Lyso |
|
Perox |
ER |
Golgi |
PM |
Cytosol |
Nucleus |
|
| Expt A |
 5
5
peptides |
12
spectra |
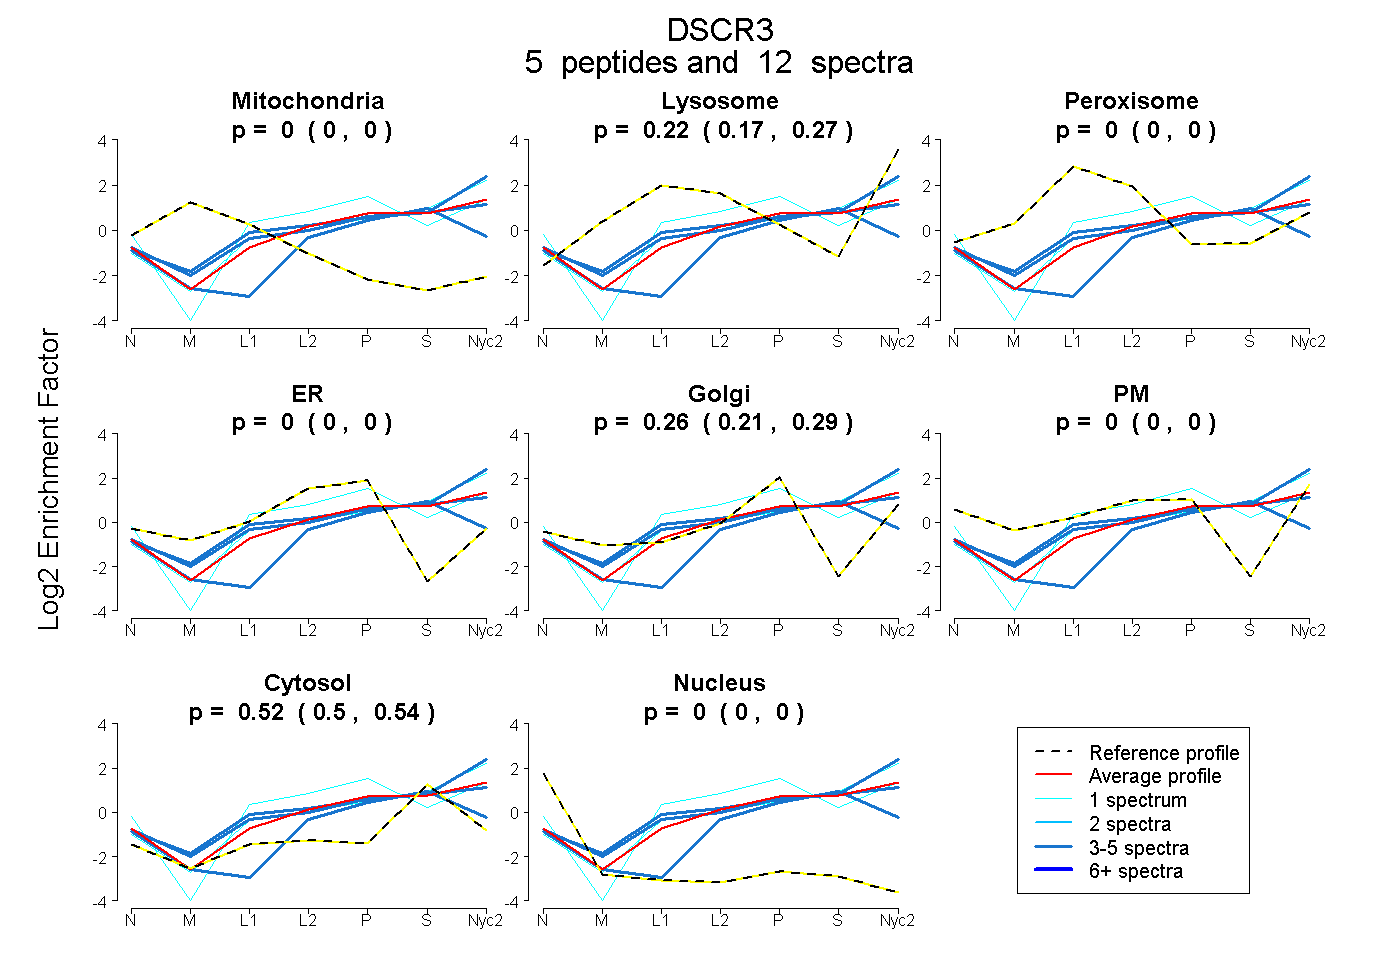 |
0.000
0.000 | 0.000 |
0.224
0.172 | 0.267 |
|
0.000
0.000 | 0.000 |
0.000
0.000 | 0.000 |
0.255
0.214 | 0.288 |
0.000
0.000 | 0.000 |
0.521
0.496 | 0.543 |
0.000
0.000 | 0.000 |
|
| | | Plot |
Mito |
|
Lyso or Perox |
|
ER |
Golgi |
PM |
Cytosol |
Nucleus |
|
| Expt B |
3
peptides |
6
spectra |
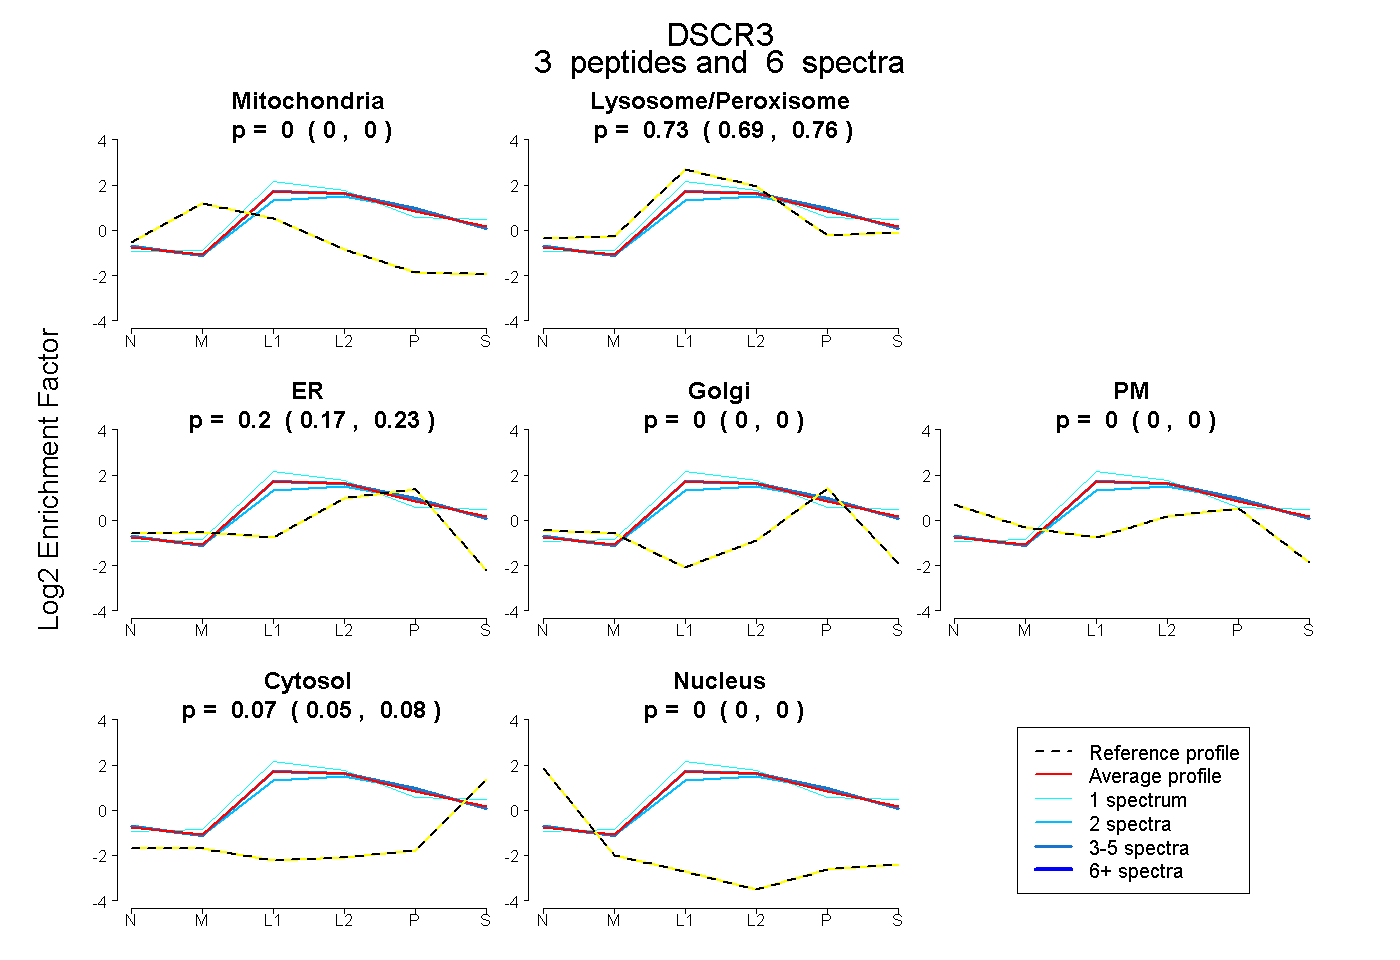 |
0.000
0.000 | 0.000 |
|
0.728
0.692 | 0.760 |
|
0.201
0.167 | 0.225 |
0.000
0.000 | 0.000 |
0.000
0.000 | 0.000 |
0.071
0.054 | 0.085 |
0.000
0.000 | 0.000 |
|
| 3 spectra, TEVPFEFPLLVK |
0.000 |
|
0.711 |
|
0.236 |
0.000 |
0.000 |
0.053 |
0.000 |
|
| 1 spectrum, NLSVPLYMVFPR |
0.000 |
|
0.864 |
|
0.058 |
0.000 |
0.000 |
0.077 |
0.000 |
|
| 2 spectra, SIELQLVR |
0.000 |
|
0.636 |
|
0.270 |
0.000 |
0.000 |
0.093 |
0.000 |
|
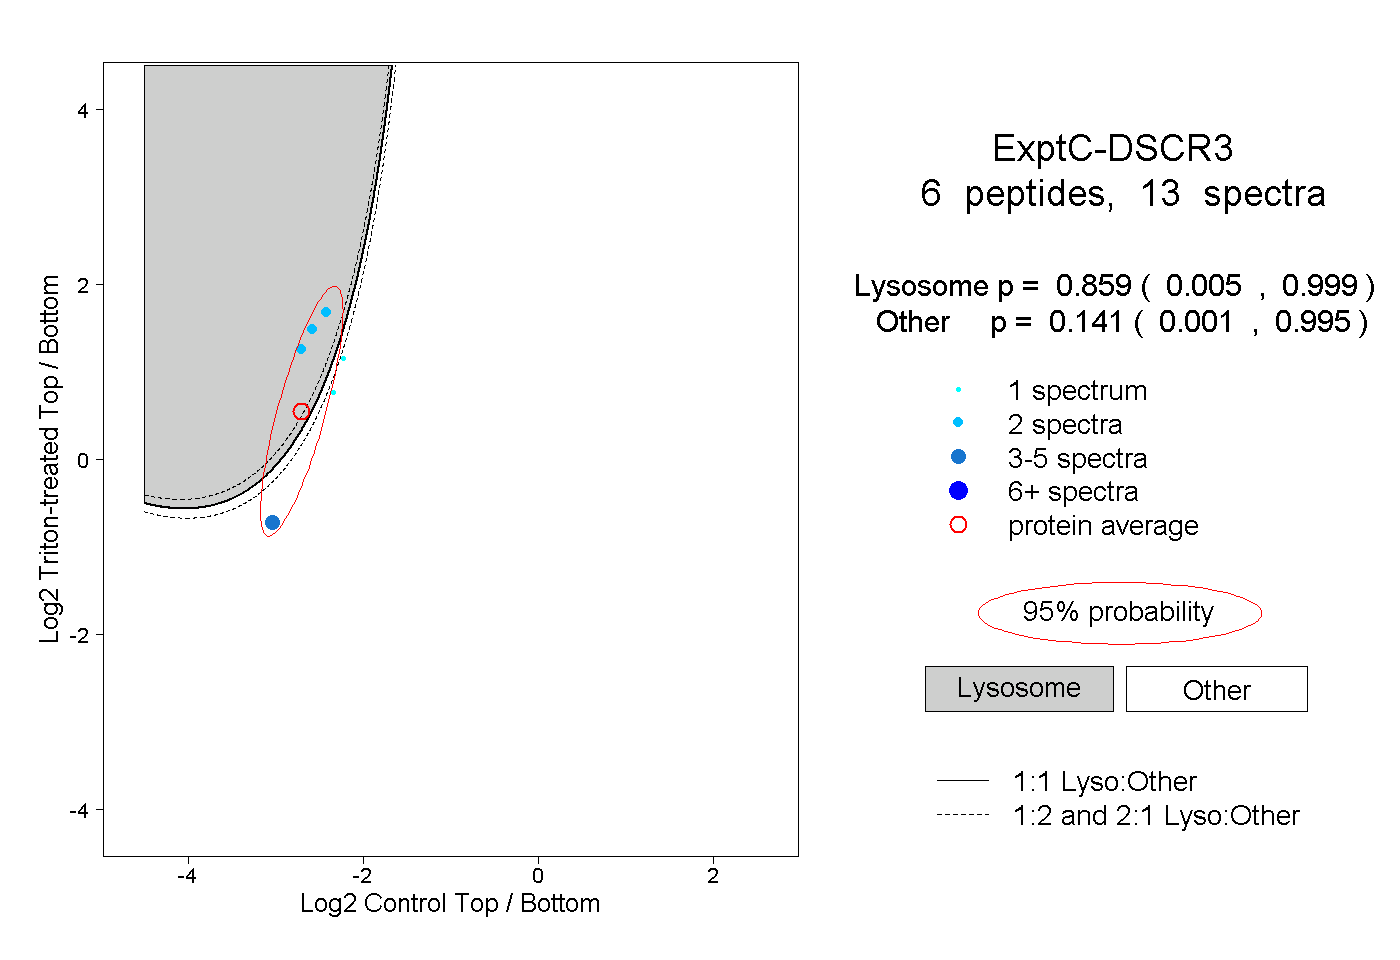
| | | Plot |
|
Lyso |
|
|
|
|
|
|
|
Other |
| Expt C |
6
peptides |
13
spectra |
 |
|
0.859
0.005 | 0.999 |
|
|
|
|
|
|
|
0.141
0.001 | 0.995 |