 25
25peptides
spectra

0.000 | 0.000
0.404 | 0.425
0.000 | 0.000
0.076 | 0.107
0.057 | 0.090
0.397 | 0.436
0.000 | 0.000
0.000 | 0.000
1peptide
spectrum

NA | NA
NA | NA
NA | NA
NA | NA
NA | NA
NA | NA
NA | NA
24peptides
spectra
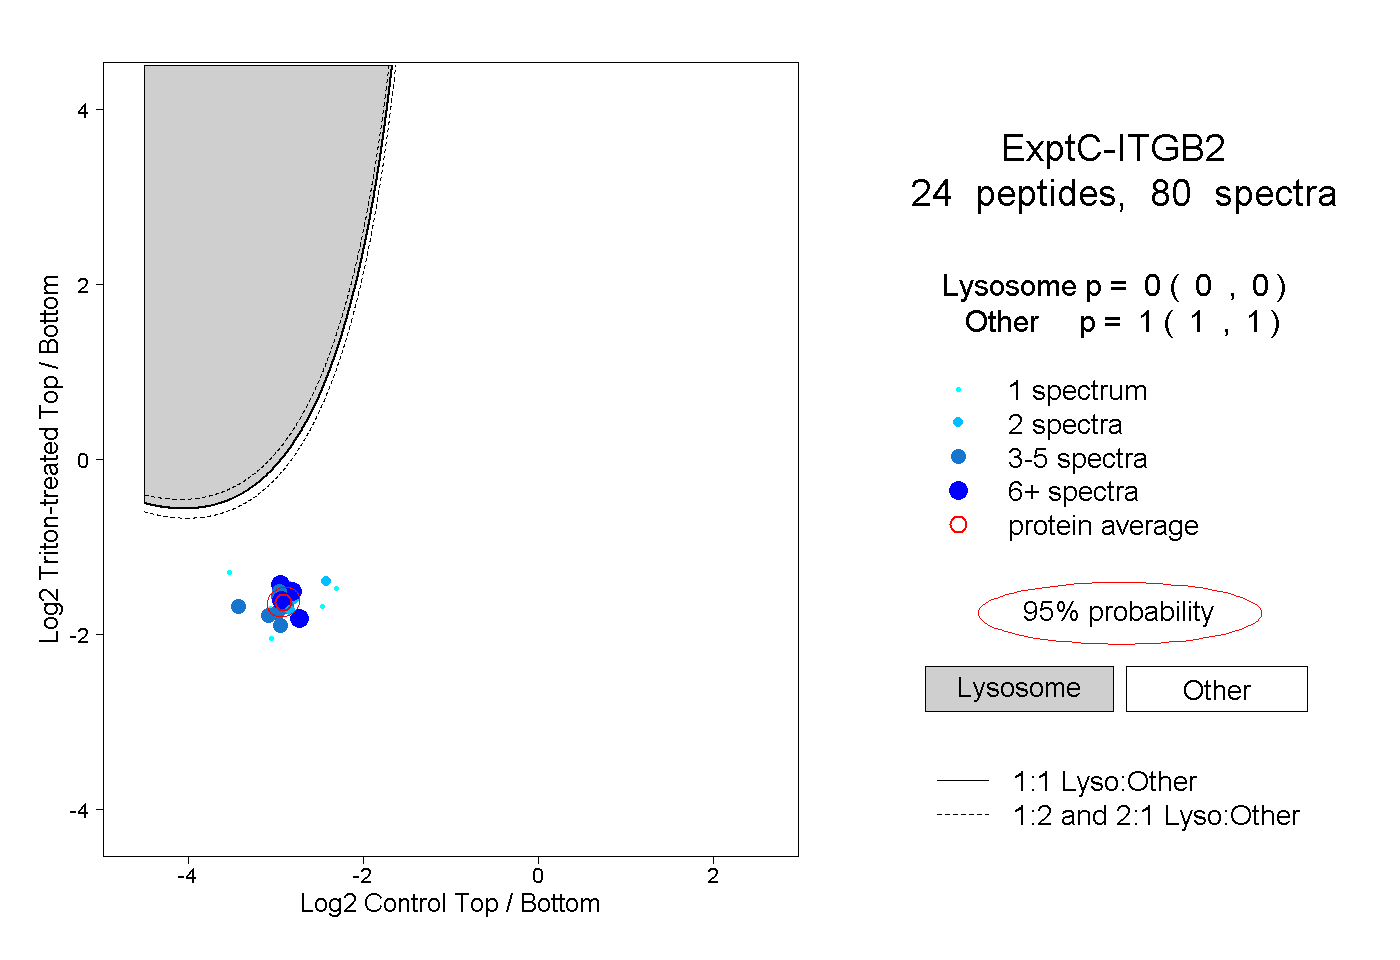
0.000 | 0.000
1.000 | 1.000
5peptides
spectra

0.000 | 0.000
1.000 | 1.000