 3
3peptides
spectra
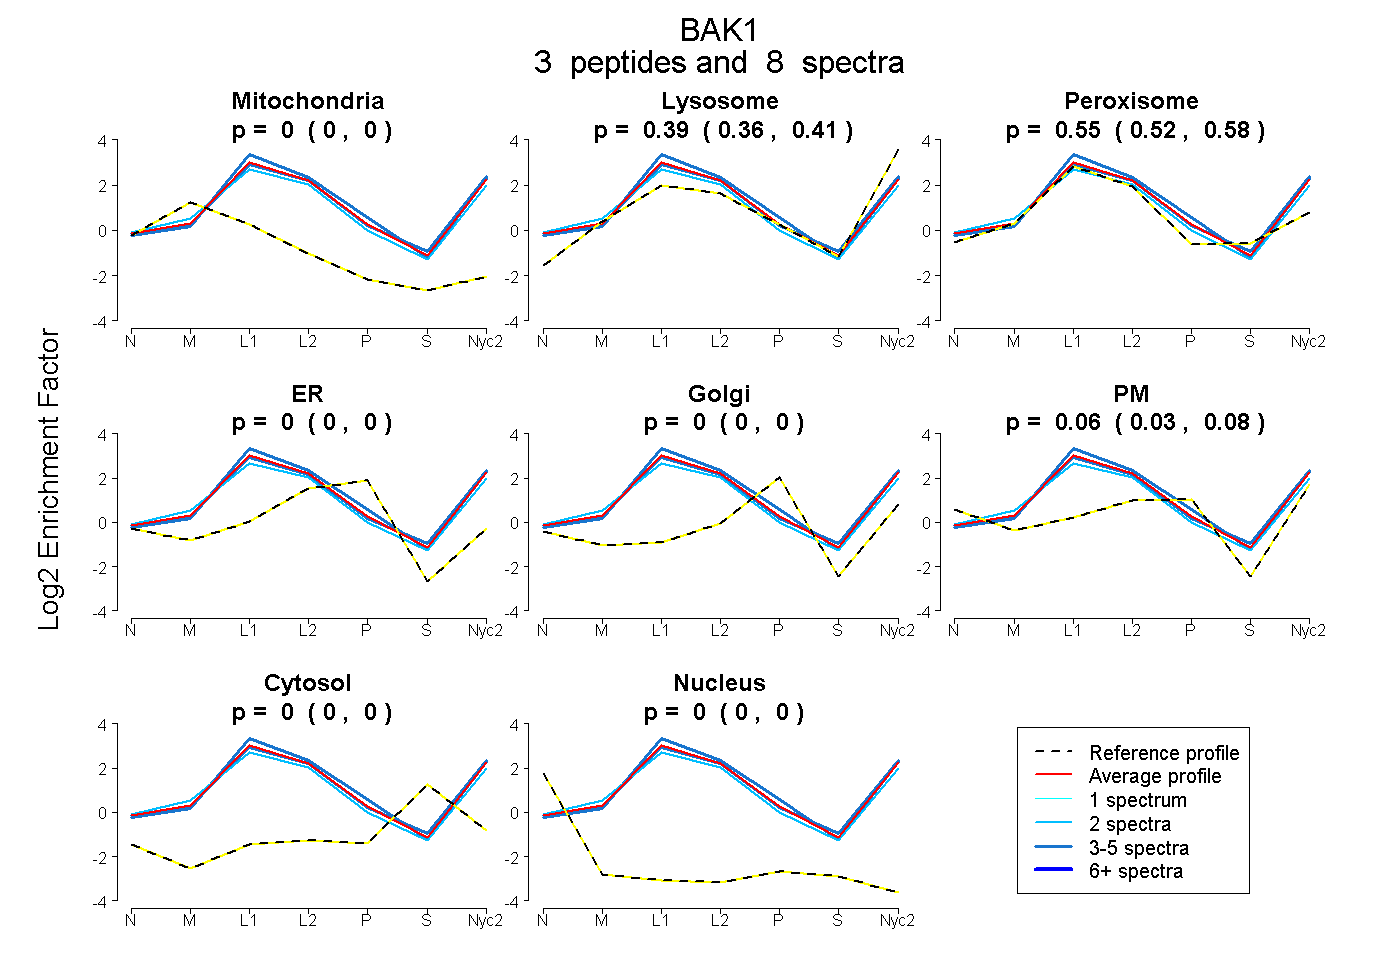
0.000 | 0.000
0.358 | 0.412
0.519 | 0.582
0.000 | 0.000
0.000 | 0.000
0.030 | 0.082
0.000 | 0.000
0.000 | 0.000
1peptide
spectrum
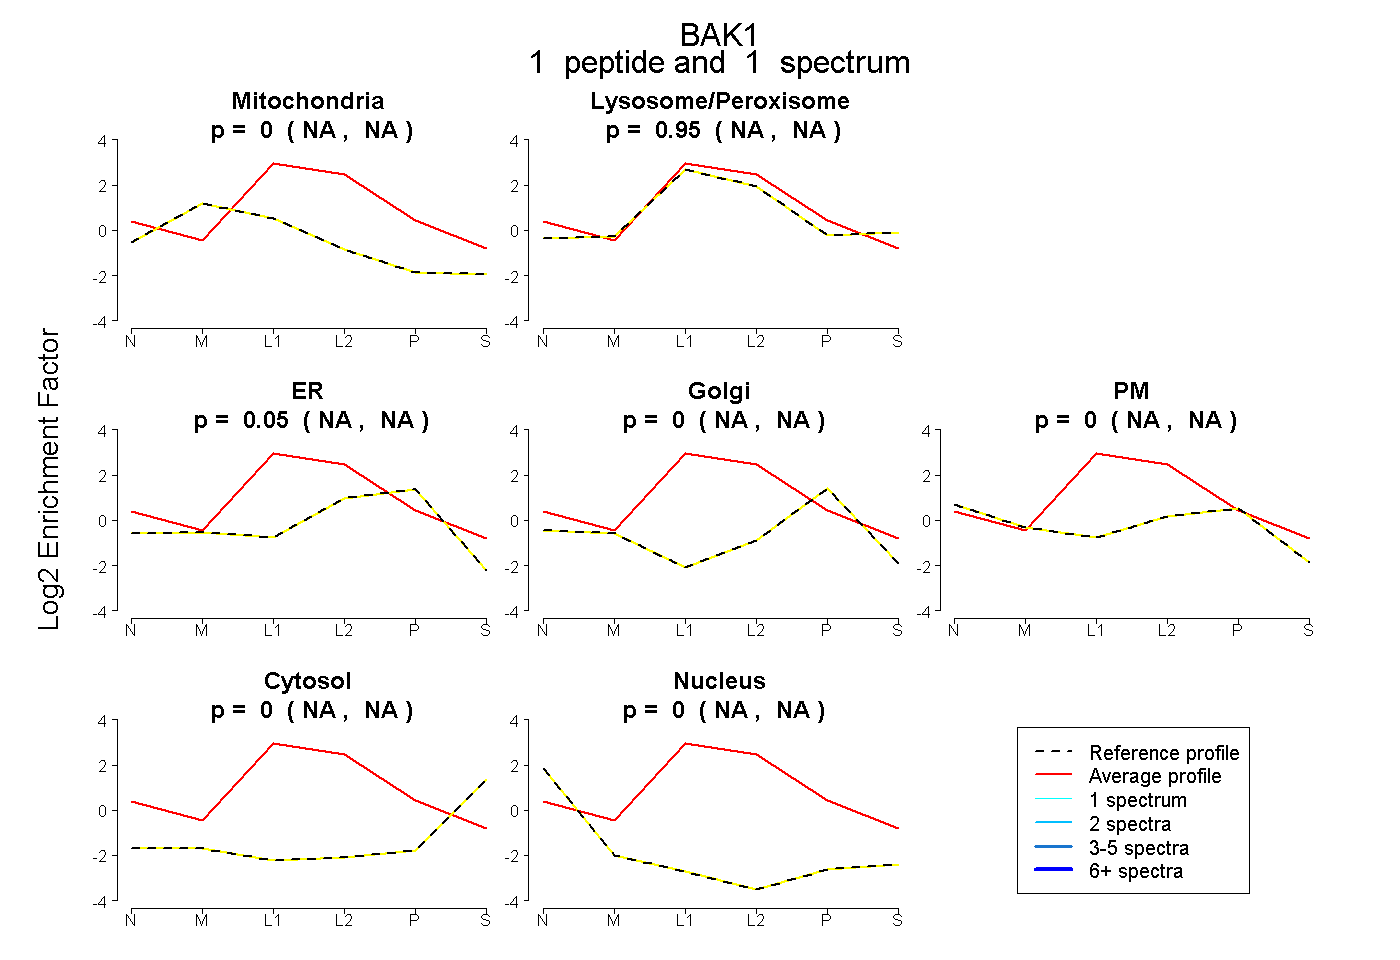
NA | NA
NA | NA
NA | NA
NA | NA
NA | NA
NA | NA
NA | NA
6peptides
spectra
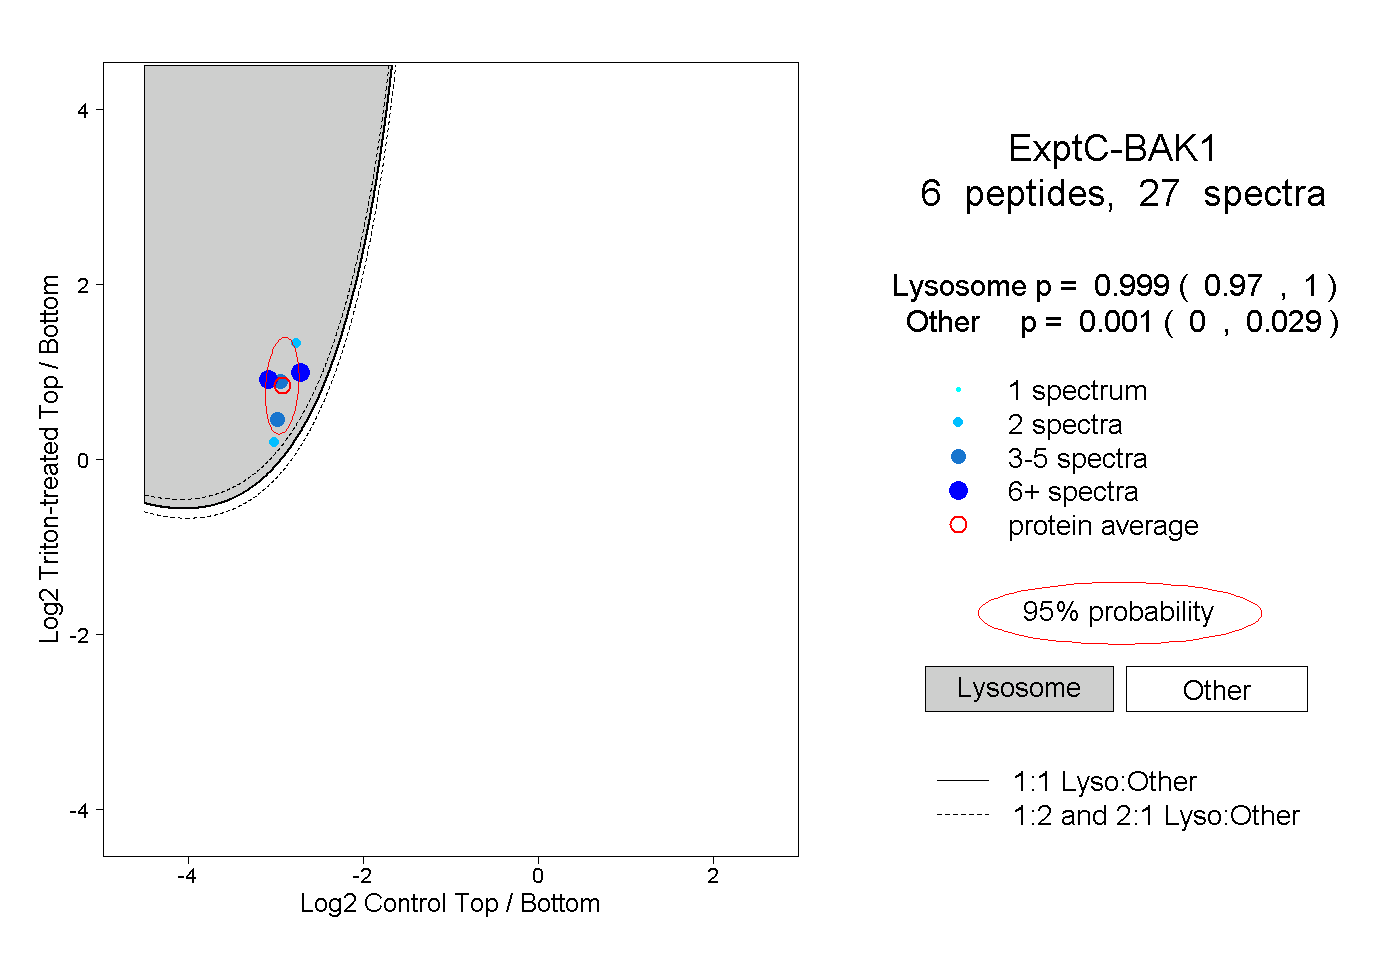
0.970 | 1.000
0.000 | 0.029
1peptide
spectra
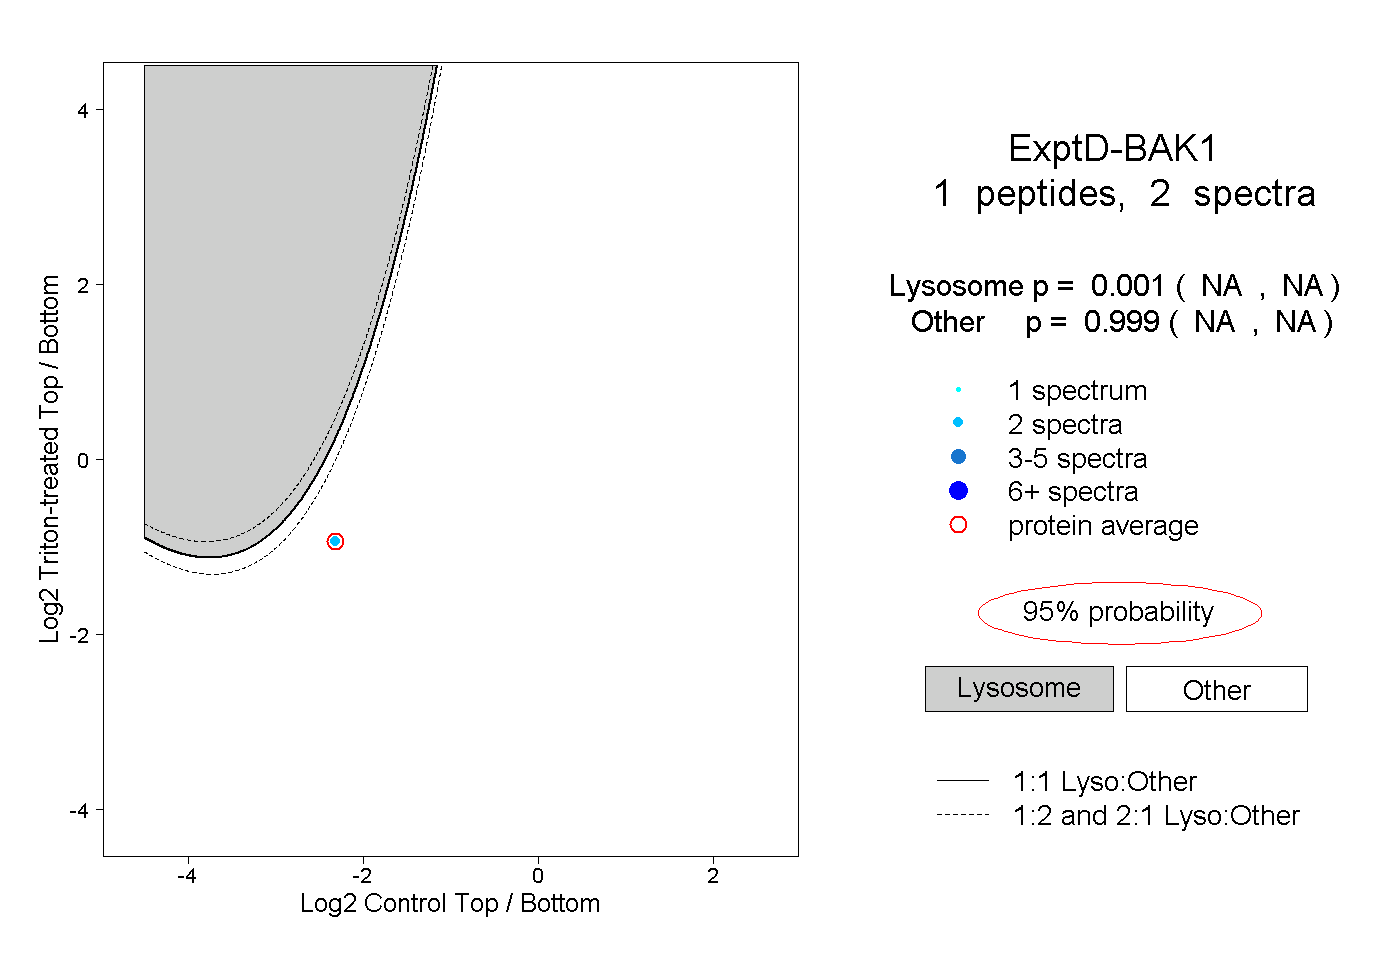
NA | NA
NA | NA